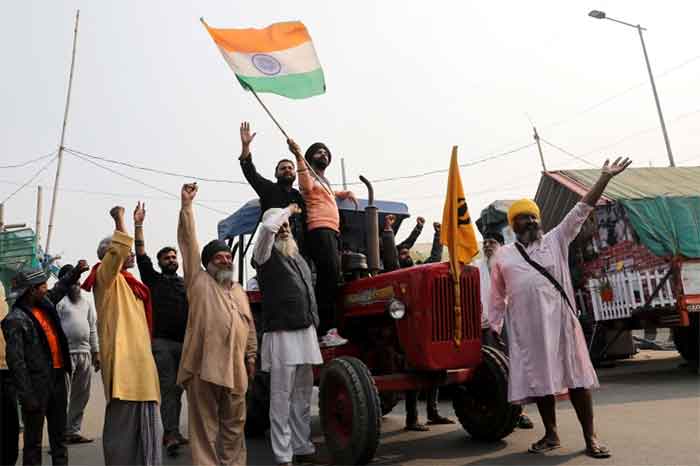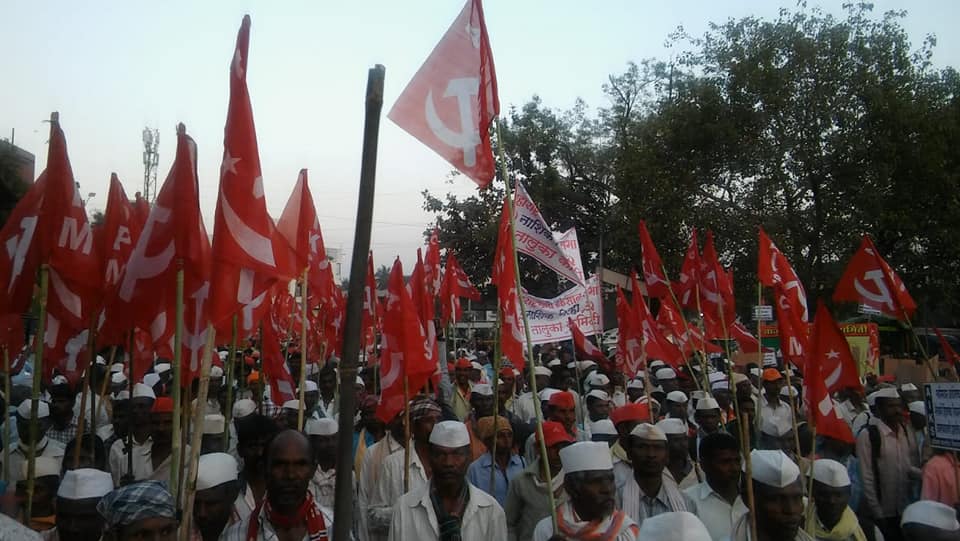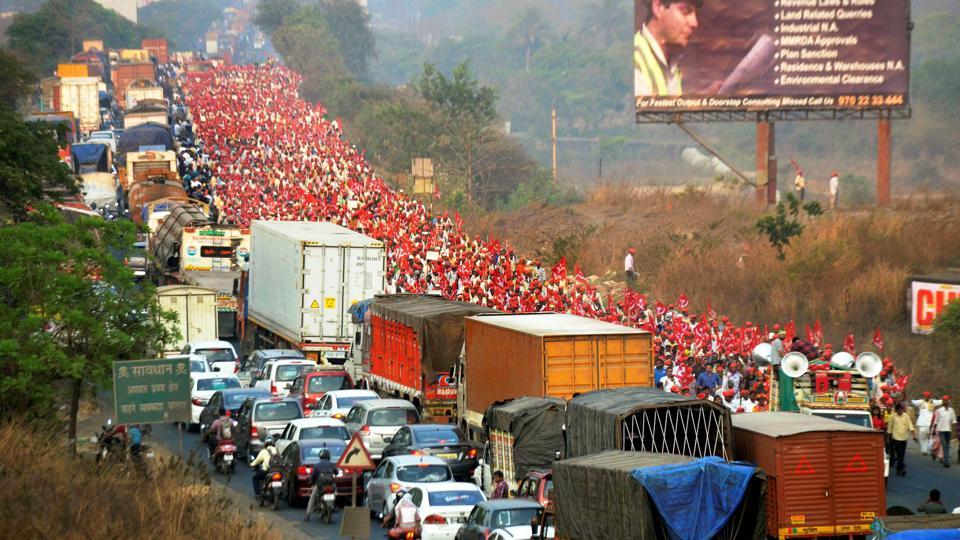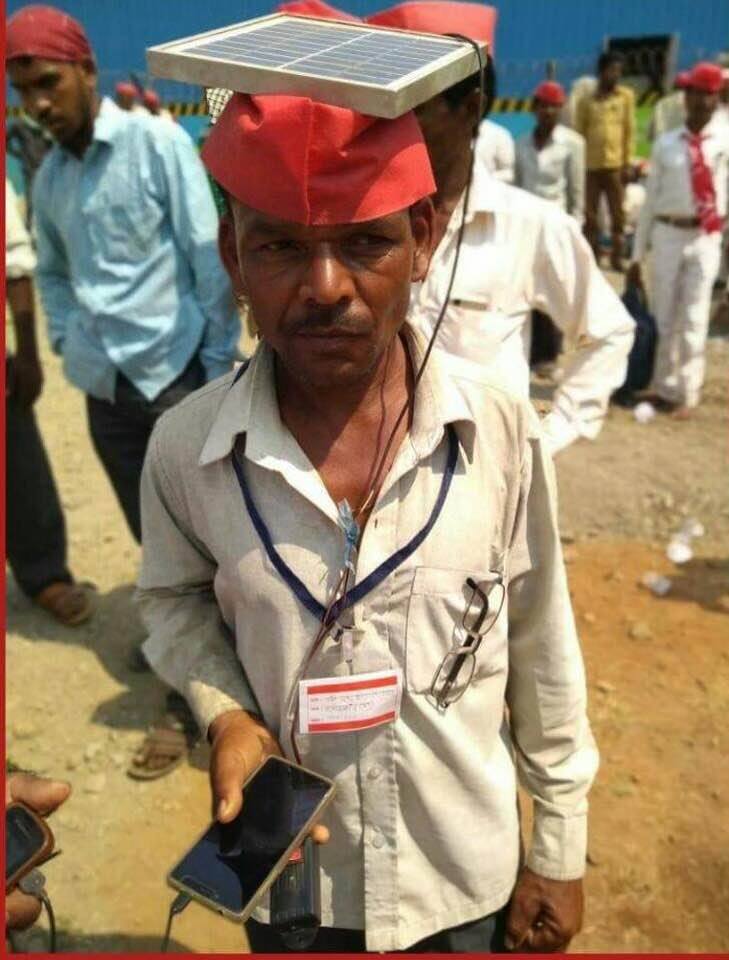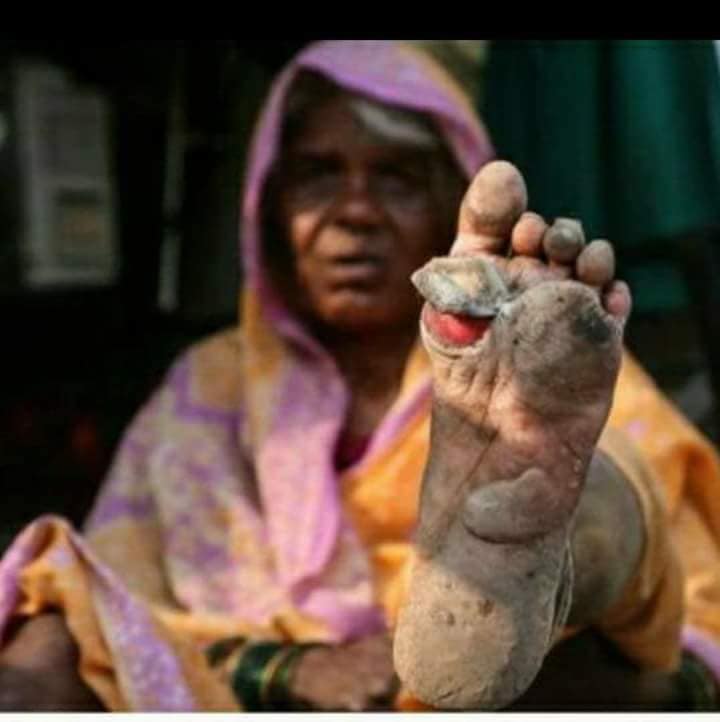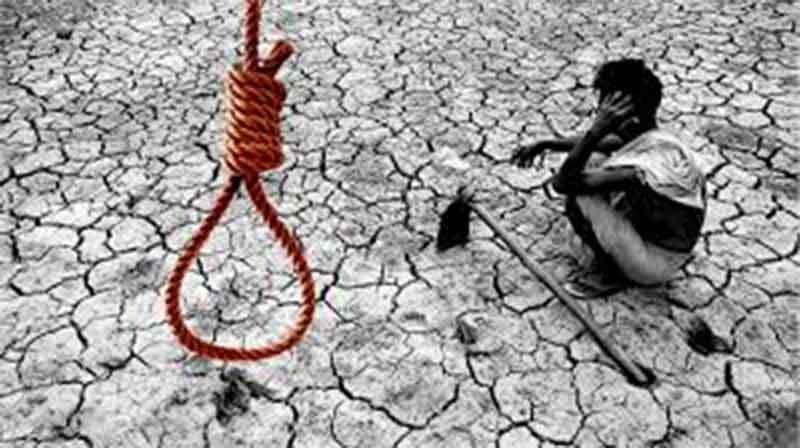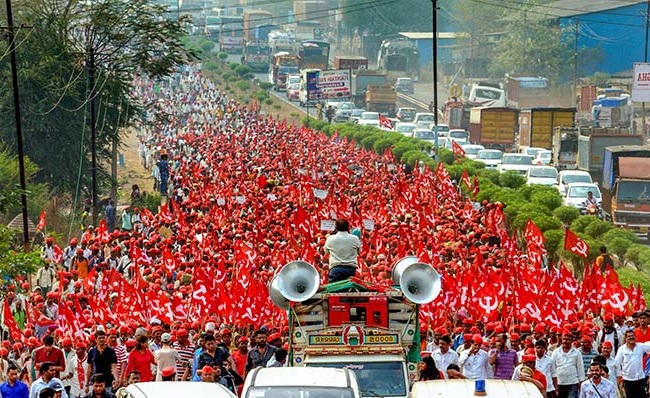
Even the establishment media ultimately could not underplay the Farmers’ March from Nasik to Mumbai in March 2018. And not long ago we saw the Farmers’ Strike in Maharashtra; that happened in June 2017. All the pictures those protests presented showed a queer image of Maharashtra, a state which is set to be a Trillion $ economy by 2025 [[1]] and a state that is one of the richest, most modern, most developed and most industrialized state in India. Of course for persons acquainted with the rural distress in Maharashtra those grim rural pictures were not startling; Maharashtra is a state where still less than one-fifth (only 18%) of agricultural land is irrigated [[2]] and hence agriculture is still rain-dependent; Maharashtra is a state which every year sees thousands of ‘farmer suicides’.
It goes to the credit of the thousands of protestors whose arduous fight could bring the plight of rural toilers back into discourse at least for time being, ‘farmer’ could become a talk of the towns and cities. However, unqualified use of the term ‘farmer’ may hide some crucial aspects of rural reality of India and also of Maharashtra.
Who are the ‘farmers’
If we look into the fact that how much land a ‘farmer’ owns and operates we can get an altogether different picture than what the much generalised ‘farmer’ term can present. The latest data we have now is from Agricultural Census 2010-2011 as the next agricultural census report is not yet published. Moreover, seldom data on ownership holding are available, and we have to guess the land ownership pattern from the operational holding data, though operational holding may include land leased in and exclude land leased out. For Maharashtra the land distribution is given in the following table.
Table 1: Distribution of Operational Land Holding in Maharashtra
| Size class (in Hectare) | Number of Holdings (‘000) | Area (‘000Ha) | Average Size (Ha) | % of Holding | % of Area |
| Sub-marginal *
(less than 0.5 Ha) |
3,646 | 918 | 0.252 | 26.62 | 4.64 |
| 0.5 – 1.0 Ha | 3,063 | 2,268 | 0.740 | 22.36 | 11.47 |
| Total Marginal
(up to 1 Ha) |
6,709 | 3,186 | 0.475 | 48.98 | 16.12 |
| Small
(1 – 2 Ha) |
4,052 | 5,739 | 1.416 | 29.58 | 29.03 |
| Semi-medium
(2 – 5 Ha) |
2,473 | 7,155 | 2.893 | 18.05 | 36.20 |
| Medium
(5 – 10 Ha) |
396 | 2,603 | 6.573 | 2.89 | 13.17 |
| Large
(10 – 20 Ha) |
59 | 752 | 12.746 | 0.43 | 3.80 |
| 20 Ha and above | 9 | 332 | 36.889 | 0.07 | 1.68 |
| All | 13,698 | 19,767 | 1.443 | 100.00 | 100.00 |
Source: Table 7.9, Economic Survey of Maharashtra 2016-17 [[3]]. * Sub-marginal category is not there in the print publication, it can be retrieved from the agriculture-census portal [[4]].
Here we can see glaring inequalities. At the bottom there are more than a quarter of the land holders, the sub-marginal ‘farmers’ who operate on less than a twentieth of the agricultural land, those 26.62% of ‘farmers’ who have only 4.64% of the land to work upon, and their ‘farm’ size is only 0.25 hectare on an average. Or, if we prefer to see the ‘marginal farmers’, who have less than a hectare of land, we see that about 49% of the ‘farmers’ or nearly bottom half of the villages who work on only16% of the agricultural land! On the other hand, we see 3.3% of the farmers who are on the top, have for them 18.68% of the agricultural land; that is, the top 3.3% have more land than the bottom half of the ‘farmers’.
Is not the rich-poor class divide in rural Maharashtra somewhat apparent from this figure? Of course only amount of land cannot give the total picture of wealth creation and distribution; irrigation, soil type, inputs availability and many other factors are there which can make a 0.5 hectare owning peasant much wealthier than another 1 hectare owning peasant.
In the upper layer of the village society there are the big landowners; often the same families control credit, agricultural machinery leasing and input trade, storing and transport business and so many other activities; also they are well connected with officials.
However, either from the news regarding the ‘Farmers’ March before, during and after that March, or from the propaganda / campaign of the organisers of the March, and also from the demands put forward by them, the class-divide within the Maharashtra villages were not evident.
Probable Beneficiaries of the promised Loan Waiver
We have already said that only amount of land cannot give the total picture of wealth creation and distribution, irrigation, soil type, inputs availability and many other factors are there which can make a 0.5 hectare owning peasant wealthier than another 1 hectare owning peasant. One such important factor is credit availability.
We have seen how loud is the demand for loan waiver; because if the outstanding loan is not waived peasants cannot continue, they will not have resources to work in the next season. (Incidentally, researchers of TISS have presented an interesting anecdote which they named ‘The March Phenomenon’: that 23% of the agricultural credit that the Scheduled Commercial Banks give are given in the month of March, which is interestingly, a lean season in terms of agricultural activity. If January, February and March, these first three months of a year or last three months of a financial year is seen, we shall find that 46.2% of agricultural credit disbursal happens in this period [[5]].) Anyway, to avail credit a ‘farmer’ will need some ‘collateral’. It is therefore ‘natural’ that poor peasants having very small land can avail small amount of loan. This can be understood from the following data:
Table 2: Direct agriculture loans – All accounts
| Amount outstanding range | Number of accounts (in lakh) | Amount outstanding (in Rs crore) | ||||||
| Allied Activity | Crop Loan | Investment Loan | Grand Total | Allied Activity | Crop Loan | Investment Loan | Grand Total | |
| Up to 1 Lakh | 46 | 380 | 121 | 547 | 12882 | 167580 | 48377 | 228839 |
| > 1.0 Lakh ≤1.5 Lakh | 2 | 64 | 18 | 84 | 2748 | 74329 | 21489 | 98567 |
| > 1.5 Lakh ≤2.0 Lakh | 1 | 27 | 9 | 37 | 1987 | 46287 | 16230 | 64504 |
| > 2.0 Lakh | 3 | 69 | 28 | 101 | 34988 | 316036 | 151525 | 502549 |
| Grand Total | 53 | 539 | 176 | 768 | 52605 | 604233 | 237620 | 894459 |
|
Of which –Direct Agricultural Loans to Small and Marginal farmers |
||||||||
| Amount outstanding range | Number of accounts (in lakh) | Amount outstanding (in Rs crore) | ||||||
| Allied Activity | Crop Loan | Investment Loan | Grand Total | Allied Activity | Crop Loan | Investment Loan | Grand Total | |
| Up to 1 Lakh | 16 | 221 | 51 | 288 | 5110 | 95675 | 19955 | 120741 |
| > 1.0 Lakh ≤1.5 Lakh | 1 | 35 | 7 | 42 | 1062 | 40412 | 7799 | 49274 |
| > 1.5 Lakh ≤2.0 Lakh | 0 | 13 | 3 | 17 | 718 | 22963 | 5671 | 29353 |
| > 2.0 Lakh | 1 | 29 | 10 | 40 | 5916 | 110398 | 42106 | 158420 |
| Grand Total | 19 | 298 | 70 | 387 | 12807 | 269449 | 75532 | 357788 |
| Note: Totals may not match due to rounding-off. Crop loans are loans extended for growing of food, cash and plantation crops. Loans for farm machinery, irrigation, and soil/land development, etc., are grouped as investment loans. Loans for dairying, poultry, fisheries, forestry, etc., form allied activities. |
||||||||
Source: Agriculture Loan Bank Accounts – A Waiver Scenario Analysis, RBI: Mint Street Memo No. 04, Dated: September 11, 2017 [[6]]
Here we find that 52% of the total outstanding amount of ‘small loans’, loans below Rs 150,000, actually went to marginal and small farmers, i.e., to farmers having up to 2 hectares of land (Rs 170015 crores out of Rs 327406 crores).If this All India distribution pattern is more or less valid for Maharashtra too, then 48% of this particular benefit will go to medium and large farmers. Incidentally, these figures are of credit given by Scheduled Commercial Banks (SCB) only, not Co-op banks, Rural Banks and etc, but these figures are indicative because more than 70% of the formal credit in agriculture now comes from the SCBs.
But how much of those loans actually are loans taken by marginal farmers only, i.e. the ‘farmers’ having less than a hectare land? This RBI memo has no answer for that question. The answer has to be calculated indirectly from works of some other researchers where we can get comparison of loans taken by different size-groups of farmers. From an IFPRI Discussion Paper, 2017 we get the following data:
Table 3: Percentage of Formal and Informal loans going to farmers of different land class
| Land
class |
Share in credit | |
| Formal
credit |
Informal
Credit |
|
| Marginal | 17.08 | 24.33 |
| Small | 25.31 | 28.07 |
| Medium | 33.27 | 29.61 |
| Large | 24.34 | 18.00 |
| All | 100.00 | 100.00 |
Source: Institutional versus noninstitutional credit to agricultural households in India: Evidence on impact from a national farmers’ survey [[7]]
Therefore, approximately ‘small farmers’ and ‘marginal farmers’ actual access to institutional credit were at a ratio of 3:2. Previously we saw that 52% of the total amount of ‘small loans’, SCB loans below Rs 150,000, actually went to marginal and small farmers, i.e., to farmers having up to 2 hectares of land (Rs 170015 crores out of Rs 327406 crores). From this we can guess that if marginal farmers fight and win loan waiver (for loans up to Rs 150,000) then major part of the benefit, might be even 80% of that, will actually be accrued by non-marginal farmers. If this seems unbelievable, we can consult another research publication – Institutional Credit to Agriculture Sector in India: Status, Performance and Determinants by Anjani Kumar et al [[8]] which clearly shows that (1) in the years 2001-02 and 2005-06, loans given to ‘marginal farmers’ and ‘small farmers’ were almost same, both around a quarter of the total amount of loans disbursed by SCBs and (2) almost half of the total loan disbursed by the SCBs went to farmers having more than 2 Ha land. If that trend continues then marginal famers are still getting around 25% of the bank credit and the rest, about 75%, is being pocketed by non-marginal farmers.
Non-institutional, non-formal loans are generally not discussed (and waived). Though, such ‘informal’ sources account for more than 36% of the total loans. Moneylenders make up the major source of the informal loans, about two-third.
Table 4: Distribution of loans by sources
| Share of formal sources | Share of informal sources | ||
| Type | % | Type | % |
| Government | 3.61 | Employer or landlord | 2.34 |
| Cooperative society | 25.37 | Agricultural professional or moneylender | 64.05 |
| Bank | 71.02 | Shopkeeper | 4.93 |
| Relatives or friends | 24.03 | ||
| Others | 4.65 | ||
| Total | 100.00 | Total | 100.00 |
| Formal sources as share of total loans | 63.56 | Informal sources as share of total loans | 36.44 |
Source: Institutional versus noninstitutional credit to agricultural households in India: Evidence on impact from a national farmers’ survey [[9]
In the previous table, Table 3, we have seen that marginal farmers are more dependent on informal loans. They are more dependent on moneylenders who give loans at much higher interest rates. And moneylenders generally belong to which can loosely be called the rural rich class which comprises of big landlords, businessmen, moneylenders etc. Is it not a fact that these people take advantage of the precarious financial position of the village poor and charge exorbitant interest rate, and they also gain from the ‘distress sale’
It is interesting to note that the organisers of the ‘Farmers March’ did not bring this issue to the forefront.
The Poor and Middle Peasants and Prices – how much will they Gain from MSP hike (and things untold)?
We have seen that in Maharashtra 26.62% of the operational holdings are ‘sub-marginal’, i.e., those having less than 0.5 Ha of land. They have only 4.64% of the agricultural land at their disposal. Average size of their farms is 0.252 Hectare (which roughly turns out to be less than 2 Bigha in Bengali land unit). We know how poor is the irrigation facility in Maharashtra, and how low is the cropping intensity (less than 1.2). So such ‘farmers’ cannot sustain their families from agricultural operation in their own farms, they must hire themselves out to earn a living. Another 22.36% of landholders have land with sizes 0.5-1 Ha, with average farm size 0.74 Ha (which roughly turns out to be 5½Bigha in Bengali land unit). They are also in a very tight corner in terms of sustaining the family if they have to survive solely depending on their agricultural land.
Marxist students of agrarian economics know that categories like Poor Peasants and Middle Peasants should not be confused with categories given in bourgeois economics like Marginal Farmers and Small Farmers. Poor Peasants and Middle Peasants are not defined only by amount of land hold by them, but also their relation with hired labour. A ‘poor peasant’ cannot sustain herself only from agricultural work (performed by self and family) on her small parcel of land (and the land leased in or land taken as a tenant); in addition, a poor peasant works as labourer to earn to maintain the family. A ‘middle peasant’ is one who can somehow manage to sustain family from agricultural work on own land (performed by self and family), but sometimes need to earn from outside her very small ‘farm’. A poor peasant is never a net hirer of labour; rather she mainly hires herself out.
On the other hand, a rich peasant, though works on own plot, has to depend largely on hired labour for farm operations; and a capitalist farmer is one who does not perform main agricultural activities (like sowing, cutting, threshing, watering etc.), who runs the ‘farm’ by hired labour.
According to NSS Report 576 based on 2012 July -2013 June data for ‘agricultural households’ in Maharashtra, households having up to 1 Ha landholding earn some 42-68% of their income from wages; households having 1 to 2 Ha landholding earn about 42% of their income from wages. [[10]]
The poor peasants and also the middle peasants need increased alternative sources of work and earning. They will be benefitted by increased job opportunity and increased wage. But these aspects were not raised during and after this Farmers March.
On the other hand – the way agriculture is done today, no ‘farmer’ produces all things needed to sustain family, not all their food items; rather the producer has to sell the produce in the market and then has to buy all necessary articles including food items. If sales proceed is made 50% more than the production cost as suggested by Swaminathan Commission Report, surely our poor peasant and middle peasant will earn more than they do at present, but they will have to buy all their food articles at higher price, may be 50% or more higher. How will that affect the poor peasants for who a substantial part of income comes not from the agriculture on own plot? If wage is static and food prices are up, it will be more difficult for poor peasants, isn’t it? Same will be the condition of agricultural and other labourers in villages.
Another important price factor for agriculture is the input prices. Prices of chemical fertilisers, insecticides and diesel etc, i.e. all the inputs that are necessary in this chemical-trapped green revolution agriculture, are increasing. Post liberalisation days saw subsidies going down. This input price rise is one of the burdens that peasants have to bear [[11]], the AIKS knows it better than us [[12]]. It is really surprising to find no loud demand regarding this input price rise during this ‘long march’? What might be the reason? Asking state to interfere in market and supply inputs to the peasants – is it ‘impractical’ and hence not voiced?
Moreover, why there were no demands for increasing NREGA over only 100 days to say 180-200 days? Why there was no demand for revising up agricultural wages?
Or was the silence on all these meant for making some sort of class-amity/truce within rural Maharashtra even if for time being! – who knows.
Compensation for Calamities and Bollworm – is that enough?
Peasants perform agricultural activities and produce food for the society. Agricultural activities, as they are now, involve several risks and one such big risk is probability of natural calamities like drought, flood, hailstorm and etc. There should be some social arrangement to help peasants, to compensate them, as and when need arises. In absence of such arrangement the government must step in.
Bollworms, particularly the pink ones, are now more of man-made or rather corporate made disasters [[13]]. Monsanto introduced genetically modified BG-I and BG-II cotton cultivation in India in collusion with the government (which permitted Monsanto to do it). Peasants were lured to this commercial crop production with false promises of no pest attack from bollworms and so no need to spend on anti-bollworm pesticides, higher production and etc. All such hypes were proved to be false. But still the government took no step against Monsanto, took no step for crop diversification program to help peasants move away from this cotton. So the government must take responsibility for losses incurred by peasants from pink bollworms.
But is that enough? What might be additional roles of a peasants’ organisation regarding this! Do they take up propaganda-campaign against GM cultivation among the peasants? Interestingly, RSS affiliated Swadeshi Jagran Manch, which spoke against GM food field trails [[14]], which once asked government to ban Monsanto [[15]] for the health and environmental hazards of the GM cotton Monsanto introduced, recently asked the government to remove royalty for BG-II cotton seeds of Monsanto [[16]], which will cheapen Monsanto GM cotton seed – Monsanto’s profit may dip a little if royalty is removed, but will it not indirectly encourage GM cotton cultivation!
Peasants’ organisations might need to ponder on agricultural practices too. For example, consider some conjectures: Can a peasants’ organisation not take up propaganda-campaign making peasants aware of how green revolution program including the so called second green revolution is actually harming humans and nature? Can a peasants’ organisation not take up awareness drive that solutions sought in market terms (like MSP hike) will not help the poor and middle peasants in the long run and instead some social control over production and distribution is needed at the start?
Several newspapers reported on March 31, 2018 that on March 2018 alone 66 farmers committed suicide in the most crisis prone districts in Maharashtra [[17]]. Even after the ‘long march’ farms and ‘farmers’ are in a vulnerable condition. Situation is demanding a radical change.
(A version of this article was published online in Frontier on April 6, 2018.)
[1] Maharashtra set to be $1-trillion economy, says Fadnavis https://www.thehindubusinessline.com/news/national/maharashtra-set-to-be-1trillion-economy-says-fadnavis/article9864065.ece
[2] Agriculture Statistics at a Glance June, 2014, as quoted in: Pradhan MantriKrishiSinchaiYojanaप्रविणकोल्हे
https://wrd.maharashtra.gov.in/portal/content/default/pdf/contents/home/kc/pmksy-ppt.pdf
[3] Page 91, Economic Survey of Maharashtra 2016-17
https://mahades.maharashtra.gov.in/files/publication/ESM_Eng2016_17.pdf
[4]http://agcensus.dacnet.nic.in/stateholdingsizeclass.aspx
[5] Bank Credit to Agriculture in India in the 2000s: Dissecting the Revival by R. Ramakumar and PallaviChavan, http://www.ras.org.in/bank_credit_to_agriculture_in_india_in_the_2000s
[6] RBI: Mint Street Memo No. 04, Dated: September 11, 2017 | Agriculture Loan Bank Accounts – A Waiver Scenario Analysis, by RajendraRaghumanda, Ravi Shankar and Sukhbir Singh, https://rbi.org.in/scripts/MSM_Mintstreetmemos4.aspx
[7]Institutional versus noninstitutional credit to agricultural households in India: Evidence on impact from a national farmers’ survey by Anjani Kumar, Ashkok K. Mishra, Sunil Saroj, Pramod Kumar Joshi, IFPRI DISCUSSION PAPER, 2017, http://www.ifpri.org/publication/institutional-versus-noninstitutional-credit-agricultural-households-india-evidence
[8] Institutional Credit to Agriculture Sector in India: Status, Performance and Determinants, by Anjani Kumar, K. M. Singh and Shradhajali Sinha, Agricultural Economics Research Review, Vol. 23 July-December 2010 pp 253-264. http://ageconsearch.umn.edu/bitstream/96935/4/6-Anjani-Kumar.pdf
[10] NSS 70th Round (January– December 2013) Report No. 576 http://mospi.nic.in/sites/default/files/publication_reports/nss_rep_576.pdf
[11] ‘Input prices have pulled down farm income’ by TV JAYAN, August 23, 2017 https://www.thehindubusinessline.com/economy/agri-business/input-prices-have-pulled-down-farm-income/article9828657.ece
[12] For example ‘The myth of remunerative farm prices’ by VIJOO KRISHNAN, June 22, 2012 (The author is Joint Secretary, All India Kisan Sabha, informs the newspaper.) https://www.thehindubusinessline.com/opinion/the-myth-of-remunerative-farm-prices/article20456815.ece1
[13] Pink bollworm may eat up half of Maharashtra’s cotton crop – The Hindu, November 17, 2017 http://kisansabha.org/aiks/aiks-in-news/pink-bollworm-may-eat-up-half-of-maharashtras-cotton-crop-the-hindu/
[14]Approval of field trials of GM food crops – A betrayal of people’s trust, Dr.Ashwani Mahajan http://swadeshionline.in/content/approval-field-trials-gm-food-crops-betrayal-peoples-trust
[15]RSS-affiliate Swadeshi JagranManch seeks ban on Monsanto, 07 April 2017, https://www.outlookindia.com/newsscroll/rssaffiliate-swadeshi-jagran-manch-seeks-ban-on-monsanto/1024197
[16]Remove royalty on BG-II cotton seeds: Swadeshi JagranManch, PTI| Feb 28, 2018, https://economictimes.indiatimes.com/news/economy/agriculture/remove-royalty-on-bg-ii-cotton-seeds-swadeshi-jagran-manch/articleshow/63107214.cms
[17]Despite loan waiver, farmers continue to commit suicide in Maharashtra, Posted at: Mar 31, 2018, 7:07 PM, http://www.tribuneindia.com/news/nation/despite-loan-waiver-farmers-continue-to-commit-suicide-in-maharashtra/566683.html
221 farmers ended lives till mid-March in Maharashtra this year, By Express News Service | Published: 31st March 2018 05:14 AM, http://www.newindianexpress.com/nation/2018/mar/31/221-farmers-ended-lives-till-mid-march-in-maharashtra-this-year-1794957.html
Sandeep Banerjee is an activist who writes on political and socioeconomic issues and also on environmental issues. Some of his articles are published in Frontier Weekly. He lives in West Bengal, India. Presently he works in a research organisation. He can be reached at [email protected]

