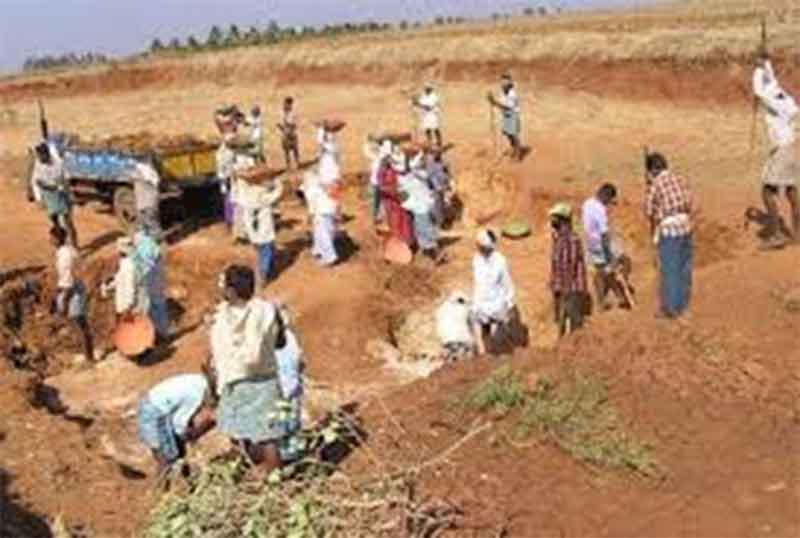
The wage rates for NREGA workers for 2019-20, notified yesterday, have again exposed central government’s lack of commitment for NREGA workers’ rights. The hike ranges from a meagre Re 1 to a majestic Rs. 17 for various states and Union Territories (UTs). And workers of 6 states and UTs will have to be content with no hike at all. Workers of poor states like Jharkhand and Bihar, who did not get a hike last year, are lucky that will get an increase of Rs. 3 and Rs. 2 respectively. The average increase in NREGA wage rate across the country is a measly 2.6%.
For 33 states and Union Territories the NREGA wage rate is less than the corresponding minimum wage for agriculture, condemning its employment guarantee act workers to another year of bonded labour. The difference is greatest in Goa, where the NREGA wage rate is only 62 per cent of the state minimum wage for agriculture. This ratio is in the range of 60-70 per cent for a number of poor states such as Telangana and Odisha (see table).
At a time when the country is going through one of the worst employment crisis in decades, this meagre hike in NREGA wages is nothing less than a much-touted “surgical strike” on the poor. Unemployment is at a historical high. The poor are still recovering from 2016’s demonetisation that crippled the informal economy that led to job-loss for millions across the country. It is ironical that while the government tom-toms about the spectacular economic growth in the last five years, rural wages have remained stagnant in the same period.
Despite recommendations from government-appointed committees to link NREGA wages with state minimum wages (by Mahendra Dev Committee) and to index the wage rate to Consumer Price Index – Rural Labourers (CPI-RL) instead of Consumer Price Index – Agricultural Labourers (CPI-AL) (by Nagesh Singh Committee), the government did not even implement these meagre recommendations.
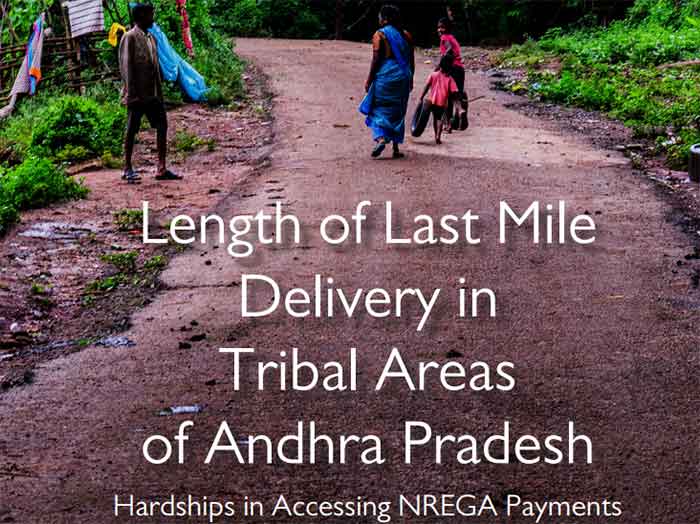
The Supreme Court has repeatedly upheld minimum wages as a fundamental right and equated payment of anything less as “forced labour”. Unremunerative NREGA wages, coupled with long delays in wage payments – even non-payment of wages in many cases – has turned many rural workers away from the employment guarantee programme.
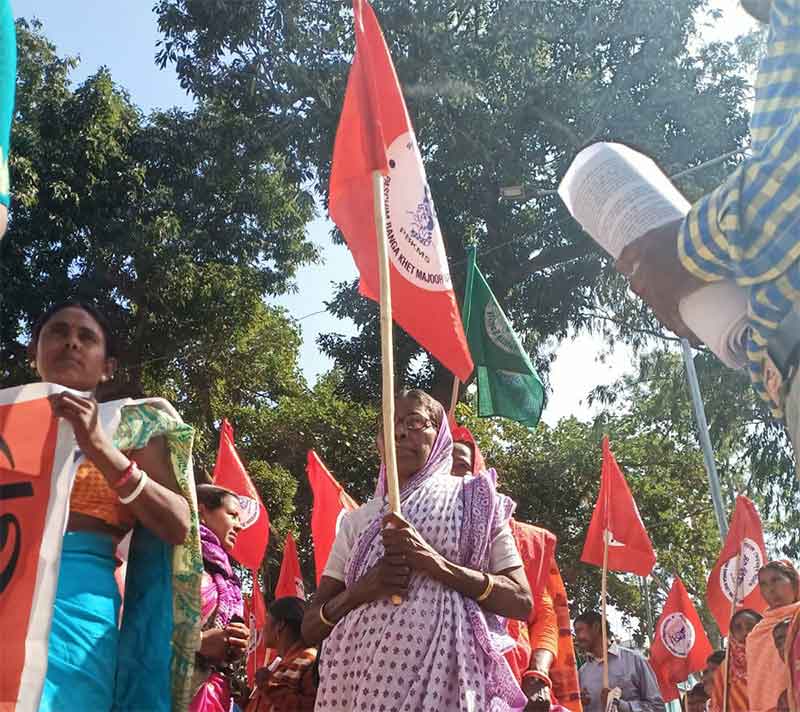
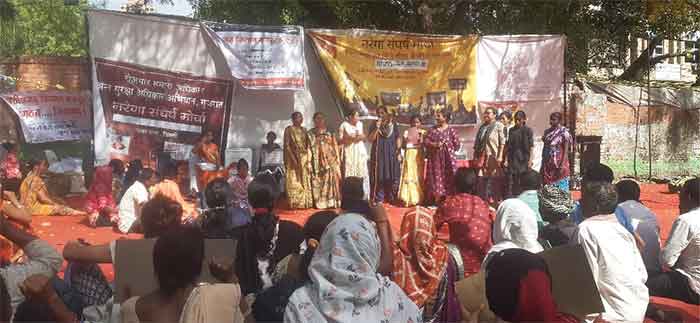
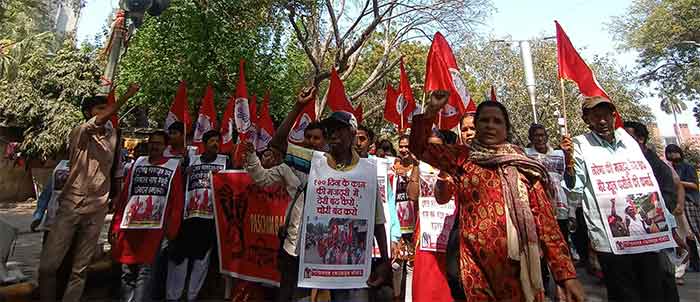
In the last few years, workers took to streets several times to demand an increase in wage rate. Jharkhand’s workers even returned the meagre hike of Rs. 5 (in 2016-17) and Re. 1 (in 2017-18) to the Prime Minister to wake him up to their reality. Amidst the political brouhaha of Ashirwad Yojana and minimum income guarantee programme, it is nothing less than a joke that the government is not able to ensure even minimum wages to workers.
NREGA Sangharsh Morcha strongly condemns this anti-workers decision and demands an increase in the NREGA wage rate to Rs 600 a day. This follows the Seventh Pay Commission recommendation of Rs 18,000 as the minimum monthly salary.
For further information, please write at [email protected] or contact Abhay Kumar (9845371493), Anuradha Talwar (9433002064), Arundhati Dhuru (9919664444), Gangaram Paikra (9977462084), Kamayani Swami (9771950248), Mukesh Nirvasat (9468862200), Neeta Hardikar (9825412387), Nirmala Tammineni (9848930031) and Richa Singh (9452232663).
| Sl No | Name Of State | NREGA wage rate in 2018-19 (Rs.) | Current Agricultural minimum wage rate | NREGA wage rate in 2019-20 (Rs.) | Increase in NREGA wage rate | Absolute difference between NREGA wage rate and agriculture minimum wage | What proportion of the minimum wage is the NREGA wage(%) |
| 1 | Andhra Pradesh | 205 | 312 | 211 | 6 | 101 | 67.63 |
| 2 | Arunachal Pradesh | 177 | 220 | 192 | 15 | 28 | 87.27 |
| 3 | Assam | 189 | 255 | 193 | 4 | 62 | 75.69 |
| 4 | Bihar | 168 | 246 | 171 | 3 | 75 | 69.51 |
| 5 | Chhattisgarh | 174 | 237 | 176 | 2 | 61 | 74.26 |
| 6 | Goa | 254 | 409 | 254 | 0 | 155 | 62.10 |
| 7 | Gujarat | 194 | 312 | 199 | 5 | 113 | 63.78 |
| 8 | Haryana | 281 | 339 | 284 | 3 | 55 | 83.78 |
| 9 | Himachal Pradesh | 184 | 225 | 185 | 1 | 40 | 82.22 |
| 10 | Jammu and Kashmir | 186 | 225 | 189 | 3 | 36 | 84.00 |
| 11 | Jharkhand | 168 | 239 | 171 | 3 | 68 | 71.55 |
| 12 | Karnataka | 249 | 269 | 249 | 0 | 20 | 92.57 |
| 13 | Kerala | 271 | 287 | 271 | 0 | 16 | 94.43 |
| 14 | Madhya Pradesh | 174 | 231 | 176 | 2 | 55 | 76.19 |
| 15 | Maharashtra | 203 | 247 | 206 | 3 | 41 | 83.40 |
| 16 | Manipur | 209 | 225 | 219 | 10 | 6 | 97.33 |
| 17 | Meghalaya | 181 | 196 | 187 | 6 | 9 | 95.41 |
| 18 | Mizoram | 194 | 250 | 211 | 17 | 39 | 84.40 |
| 19 | Nagaland | 177 | 115 | 192 | 15 | -77 | 166.96 |
| 20 | Odisha | 182 | 280 | 188 | 6 | 92 | 67.14 |
| 21 | Punjab | 240 | 315 | 241 | 1 | 74 | 76.51 |
| 22 | Rajasthan | 192 | 213 | 199 | 7 | 14 | 93.43 |
| 23 | Sikkim | 177 | 300 | 192 | 15 | 108 | 64.00 |
| 24 | Tamil Nadu | 224 | 243 | 229 | 5 | 14 | 94.24 |
| 25 | Telangana | 205 | 312 | 211 | 6 | 128 | 67.62 |
| 26 | Tripura | 177 | 302 | 192 | 15 | 110 | 63.58 |
| 27 | Uttar Pradesh | 175 | 192 | 182 | 7 | 10 | 94.79 |
| 28 | Uttarakhand | 175 | 260.5 | 182 | 7 | 78.5 | 69.87 |
| 29 | West Bengal | 191 | 245 | 191 | 0 | 54 | 77.96 |
| 30 | Andaman and Nicobar | 250 | 451 | 250 | 0 | 201 | 44.57 |
| 31 | Chandigarh | 273 | 376 | NA | NA | NA | NA |
| 32 | Dadra and Nagar Haveli | 220 | 294 | 224 | 4 | 70 | 76.19 |
| 33 | Daman and Diu | 197 | 294 | 202 | 5 | 92 | 68.71 |
| 34 | Lakshadweep | 248 | 401 | 248 | 0 | 153 | 61.85 |
| 35 | Puducherry | 224 | 368 | 229 | 5 | 139 | 62.23 |