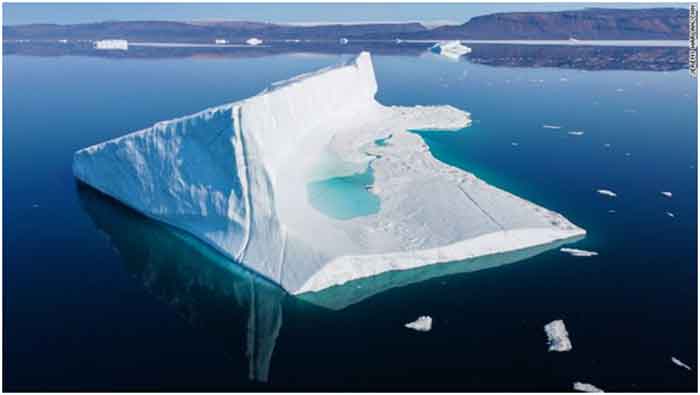
Greenland’s ice sheet, — the world’s second-largest ice body, would continue to lose ice even if global temperatures stop rising, and it may have passed a point of no return, setting it on an irreversible path to complete disappearance, according to scientists at Ohio State University.
Snowfall that normally replenishes Greenland’s glaciers each year can no longer keep up with the pace of ice melt, according to the scientists. This means that the Greenland ice sheet would continue to lose ice even if global temperatures stop rising.
In their study, (Michalea D. King, Ian M. Howat, Salvatore G. Candela, Myoung J. Noh, Seonsgu Jeong, Brice P. Y. Noël, Michiel R. van den Broeke, Bert Wouters, & Adelaide Negrete, “Dynamic ice loss from the Greenland Ice Sheet driven by sustained glacier retreat”, Communications Earth & Environment, volume 1, article number: 1 (2020), August 13, 2020) published Thursday in the journal Nature, the scientists reviewed 40 years of monthly satellite data from more than 200 large glaciers that are draining into the ocean across Greenland.
Their observations show how much ice breaks off into icebergs or melts from the glaciers into the ocean. They also show the amount of snowfall each year — the way these glaciers get replenished.
The researchers found that, throughout the 1980s and 90s, snow gained through accumulation and ice melted or calved from glaciers were mostly in balance, keeping the ice sheet intact. Through those decades, the researchers found, the ice sheets generally lost about 450 gigatons (about 450 billion tons) of ice each year from flowing outlet glaciers, which was replaced with snowfall.
Before 2000, the ice sheet would have about the same chance to gain or lose mass each year. In the current climate, the ice sheet will gain mass in only one out of every 100 years.
The scientists’ analysis found that the baseline of that pulse — the amount of ice being lost each year — started increasing steadily around 2000, so that the glaciers were losing about 500 gigatons each year. Snowfall did not increase at the same time, and over the last decade, the rate of ice loss from glaciers has stayed about the same — meaning the ice sheet has been losing ice more rapidly than it is being replenished.
“What we’ve found is that the ice that’s discharging into the ocean is far surpassing the snow that’s accumulating on the surface of the ice sheet,” said Michalea King, the study’s lead author and researcher at Ohio State University’s Byrd Polar and Climate Research Center, in a press release. “We’ve been looking at these remote sensing observations to study how ice discharge and accumulation have varied,” said Michalea King.

Satellite image shows meltwater ponding on the surface of the ice sheet in northwest Greenland near the sheet’s edge on Monday, July 30, 2019. While the heat wave broke in Western Europe after a few days, extreme temperatures shifted north and caused massive ice melts in Greenland and the Arctic.
“Glacier retreat has knocked the dynamics of the whole ice sheet into a constant state of loss,” Ian Howat, a glaciologist and co-author on the paper, said in the release. “Even if the climate were to stay the same or even get a little colder, the ice sheet would still be losing mass.”
But this is just one of many climate-change tipping points that human activity might bring about. There is still time to avoid irreversible pathways to other calamities.
The amount of ice Greenland loses each year has steadily increased in the last two decades. Before 2000, the researchers found, the ice sheet had an equal chance of gaining or losing mass each year. But in the climate of the last 20 years, it will only gain mass one in every 100 years, the researchers found.
Greenland dumped an unprecedented amount of ice and water into the ocean during the summer of 2019, when a heat wave from Europe washed over the island. The ice sheet lost 55 billion tons of water over five days — enough to cover the state of Florida in almost five inches of water.

Ice melt formed whitewaters in Kangerlussuaq, Greenland on August 1, 2019.
Melt brings about more melt, as water pooling across the ice sheet absorbs more sunlight and further heats everything around it. That is why tipping points like Greenland’s accelerate ice loss so much.
Even for the Greenland ice sheet, the future holds more tipping points — degrees of collapse that will accelerate the glaciers’ melt even more. Limiting global warming could delay those tipping points and give the world more time to prepare.
“We’ve passed the point of no return, but there’s obviously more to come,” Howat told CNN. “Rather than being a single tipping point in which we’ve gone from a happy ice sheet to a rapidly collapsing ice sheet, it’s more of a staircase where we’ve fallen off the first step but there’s many more steps to go down into the pit.”
“We are measuring the pulse of the ice sheet — how much ice glaciers drain at the edges of the ice sheet — which increases in the summer. And what we see is that it was relatively steady until a big increase in ice discharging to the ocean during a short five- to six-year period,” King said.
“Glaciers have been sensitive to seasonal melt for as long as we’ve been able to observe it, with spikes in ice discharge in the summer,” she said. “But starting in 2000, you start superimposing that seasonal melt on a higher baseline—so you’re going to get even more losses.”
King said that large glaciers across Greenland have retreated about 3 kilometers on average since 1985 — “that’s a lot of distance,” she said. The glaciers have shrunk back enough that many of them are sitting in deeper water, meaning more ice is in contact with water. Warm ocean water melts glacier ice, and makes it difficult for the glaciers to grow back to their previous positions.
That means that even if humans were somehow miraculously able to stop climate change in its tracks, ice lost from glaciers draining ice to the ocean would likely still exceed ice gained from snow accumulation, and the ice sheet would continue to shrink for some time.
“Glacier retreat has knocked the dynamics of the whole ice sheet into a constant state of loss,” said Ian Howat, a co-author on the paper, professor of earth sciences and distinguished university scholar at Ohio State. “Even if the climate were to stay the same or even get a little colder, the ice sheet would still be losing mass.”
Shrinking glaciers in Greenland are a problem for the entire planet. The ice that melts or breaks off from Greenland’s ice sheets ends up in the Atlantic Ocean — and, eventually, all of the world’s oceans. Ice from Greenland is a leading contributor to sea level rise — last year, enough ice melted or broke off from the Greenland ice sheet to cause the oceans to rise by 2.2 millimeters in just two months.
The new findings are bleak, but King said there are silver linings.
“It’s always a positive thing to learn more about glacier environments, because we can only improve our predictions for how rapidly things will change in the future,” she said. “And that can only help us with adaptation and mitigation strategies. The more we know, the better we can prepare.”
Other Ohio State researchers who worked on this study are Salvatore Candela, Myoung Noh and Adelaide Negrete.
The research paper prepared on the basis of the study said:
The Greenland Ice Sheet is losing mass at accelerated rates in the 21st century, making it the largest single contributor to rising sea levels. Faster flow of outlet glaciers has substantially contributed to this loss, with the cause of speedup, and potential for future change, uncertain.
In the study, the scientists combined more than three decades of remotely sensed observational products of outlet glacier velocity, elevation, and front position changes over the full ice sheet.
They compared decadal variability in discharge and calving front position and find that increased glacier discharge was due almost entirely to the retreat of glacier fronts, rather than inland ice sheet processes, with a remarkably consistent speedup of 4–5% per km of retreat across the ice sheet.
The scientists, according to the paper, showed that widespread retreat between 2000 and 2005 resulted in a step-increase in discharge and a switch to a new dynamic state of sustained mass loss that would persist even under a decline in surface
The paper said:
The Greenland Ice Sheet (GrIS) has been losing mass for several decades1due to both increased surface melt water runoff and ablation of marine-terminating outlet glaciers via calving and submarine melting, termed ice discharge. Total GrIS mass loss over the 1992–2018 period was due to approximately equal contributions from both terms1but with greater contribution from increased melt runoff after 2000, when mass losses accelerated 2–4. Estimates of ice sheet discharge over multiple decades and at annual, or finer, resolution provide insight into the ice sheet’s response to long-term climate forcing and ongoing change. Seasonal and interannual variability in ice sheet dynamics are challenging to resolve prior to the year 2000 due to temporal and spatial data gaps.
The scientists applied rigorous methodology in to gain improved constraints on estimates of ice sheet discharge over three decades, including the period leading up to the onset of rapid glacier retreat and acceleration. Rates of Greenland glacier retreat have accelerated and previous work has identified relationships between glacier speed and retreat and glacier area for smaller subsets of Greenland glaciers.
They then combined these data with high-resolution observations of time-varying calving front position changes and perform a GrIS-wide analysis of how these two variables relate on individual, regional, and ice sheet-wide spatial scales over the multi-decadal record.
In the paper, they discuss the timing of changes in retreat, thinning, and acceleration across the ice sheet, quantify the sensitivity of ice discharge to retreat, and describe the roles of both long-term changes in ice dynamics and surface mass balance in preconditioning regions of the ice sheet for rapid retreat, thinning, and accelerated discharge.
The scientists find that GrIS-wide discharge is now ~14% greater than the rate observed during 1985–1999, following an observed step-increase during the early 2000’s. Widespread glacier retreat explains nearly all (>90%) of the observed multi-decadal variability in discharge, with a observed increase in discharge of 4–5% per every weighted mean kilometer of retreat.
They also find that this sensitivity is proportionally consistent across different regions of the ice sheet, despite highly variable long-term trends in discharge. Following the step-increase in discharge, GrIS-wide total shave remained relatively stable at rates near 495–500 Gt yr−1, reflecting an increase that was sufficient to effectively shift the ice sheet to a state of persistent mass loss. Results Long-term changes in ice discharge and comparison with other studies.
They also find a step-increase in decadal-scale ice discharge, with a ~60 Gt yr−1, or 14%, increase between 1985–1999and 2007–2018 means. After reaching a temporally local maximum in 2005, annual D then temporarily decreased for 3 years. Following the temporary decline, discharge accelerated again at a slower pace of 2 Gt yr−2during 2008–2018, reaching a peak annual value of 502 ± 9 Gt yr−1in 2017 and 2018, or 17% above the 1980’s average. The increase in mean annual D since 2008 has been mostly due to a steady increase in seasonal minimum values increasing with a trend of 3 Gt yr−2since 2007, indicating greater wintertime velocities relative to summertime maxima, most evident in the northwest and in the most recent 3 years of the central west. The seasonal amplitude in D has also changed, increasing by nearly 50%, from a 1985–1990 average of 17 ± 6 to 25 ± 6 Gt yr−1for 2000–2018. To account for the uncertainty in D due to this temporal gap in ice thickness observations, we estimate D assuming the end member-cases of (1) all thickness change occurring in the first year, which maximizes the impact of thinning at the start of the period, and (2) all thinning occurring in the last year, which minimizes the impact until ~2000.
They found that during the 1985–1999 period, estimates of D can vary by an average 13 Gt yr−1 depending on when thinning occurred between temporally sparse elevation data. Discharge has increased in every region of the ice sheet since the 1980’s, but with contrasting temporal variability. In the west, discharge slightly declined from 1985 to the late 1990’s prior to larger increases after 2000. The central west is dominated by Jakobshavn Isbræ, which accounted for an average of 30% of the regional discharge. Within the CW, discharge steadily increased by 27% after the initial retreat and acceleration of Jakobshavn Isbræ in 19999to a peak in 2014 before declining10% through 2018 due to Jakobshavn’s slowdown. Jakobshavn’s observed slowdown was responsible for the majority (>75%) of the net decrease in Din the CW region, with only two other glaciers showing notable deceleration during this time. In the northwest, gradual increases in discharge began in the early 2000’s and have since accelerated, increasing 36% by 2018. In the east, discharge was relatively stable during the 1980’s and 1990’s, with increases beginning in the southeast in 2000 with the synchronous retreat and acceleration of multiple glaciers, including Helheim. After increasing ~18% between 2000 and 2005, discharge in the SE then suddenly declined to within5% above its initial [1980s mean] values, varying by 10% over the next decade with no clear trend. Pronounced acceleration did not begin in the central east until the 2004 retreat and acceleration of its largest glacier, Kangerdlugssuaq, that caused a nearly 20% increase in annual D between 2003and 2005. Following a decline and relative stability, another large retreat event at Kangerdlugssuaq in 201614 caused D to again rise near its 2005 maximum.
They exclude discussion of regional patterns observed in the northern and southwestern regions due to small glacier sample size, but include regional discharge totals (with each of the two regions contributing, on average,~10 Gt yr−1).
The study found:
Out of the 128 glaciers with continuous records between 1985 and 2018, nearly 70% display a significant (p≤0.05) relationship between changes in discharge and front position. These glaciers account for ~75% of the total D. Only 24 (19%) glaciers, accounting for 6% of D, exhibit a significant negative correlation (i.e., decreasing D with retreat) between discharge and front position. These glaciers tend to have more static fronts, varying only ~1 km between 1985 and 2018, compared with 4 km for those where positive correlations are observed, and include quiescent phase surge-type glaciers and those that have retreated along prograde bed slopes (i.e., Upernavik Isstrøm) during the observation period.
Retreat occurs through increased calving due to melting at the ice front and/or thinning of the glacier terminus toward flotation.
They investigated the timing and magnitudes of regional retreat and thinning, weighted by discharge.
Year 3000 and a 23-feet rise
Complete melting of the Greenland ice sheet could raise sea levels 23 feet by the year 3000. If that happens, the ocean would swallow coastal cities across the globe. Greenland’s ice is already the world’s largest single contributor to sea-level rise. In just the next 80 years, its current melt rate would add another 2.75 inches to global sea levels, according to a study published in December.
Rising global temperatures and certain human activities can bring about tipping points in other parts of the world, too.
The climate crisis could bring about other tipping points in the Arctic and the Amazon, but there may still be time to avoid those.
The Arctic
In the Arctic, ice melt is exposing permafrost — frozen soil that releases powerful greenhouse gases when it thaws. If warming thaws enough permafrost, the gases released will trap heat faster than humans’ fossil-fuel emissions.
The Amazon
In the Amazon rainforest, humans have been cutting and burning trees for years, allowing moisture to escape the ecosystem. Enough deforestation could trigger a process called “dieback,” in which the rainforest would dry up, burn, and become a savanna-like landscape, releasing up to 140 billion tons of carbon into the atmosphere. Last year, leading rainforest scientists warned that the Amazon is “teetering on the edge” of that threshold.

The four stages of land management on a big cattle farm in the Brazilian Amazon: clear land where the forest has recently been burned and grass will be grown (foreground), a pasture waiting for the cattle (right), forest being burned to make pasture (background), and native forest which will soon undergo the same (left). Ricardo Funari/Getty
Still, scientists say that switching to less carbon-intensive forms of energy, like solar power, and reducing unsustainable logging and mining can help us avoid those disasters.
SIGN UP FOR COUNTERCURRENTS DAILY NEWSLETTER