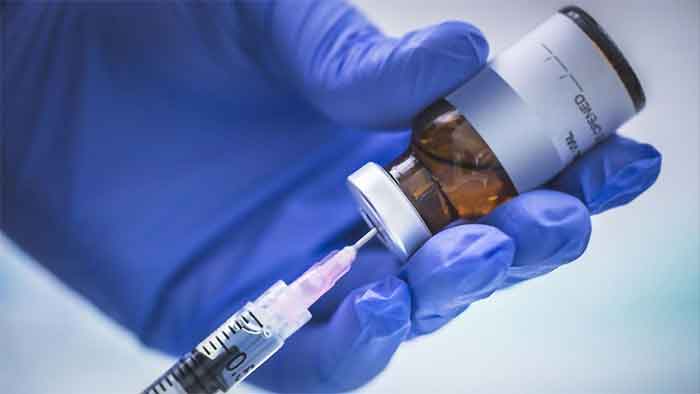
With a confirmed caseload of more than 8.5 million as on 08 November 2020, India is the second Covid power in the world. The USA is of course on top of the heap with more than 10 million cases. Infection rate (cases per 1000 population) is 31 in the world, 6.1 in India, and 31 on the US. Andorra, an independent principality with a population of 77,000 people, situated between France and Spain in the Pyrenees mountains, has the highest infection rate of 70, followed by Bahrain and Qatar with 48 per 1000 people. The case-fatality rate ( CFR- death per 1000 confirmed cases) is 25.8 in the world. Mexico with a CFR of 100 is on top; Singapore with a CFR of 5 has the lowest rare. CFR is India is 15/1000. Within India, there are wide variations in infection rate and fatality rates between the States and the districts. The infection rate is 6.1 and case fatality rate is 15 in India. State wise details are given in graph 1 below.

Graph 1- infection rate per 1000 population and case fatality rate per 1000 cases – India as on 07 November 20 by states. Data courtesy: https://covidindia.org/
Covid-19 in Kerala
Kerala has a population of 38 million, and a caseload of 466,466 and 1613 deaths as on 05 Nov 20. The infection rate is 12.2 per 1000 people and the fatality rate is 3.5 per 1000 cases. Among the 14 districts, Pathanamthita with a population of 1.4 million and an infection rate of 11.7 per 1000 people has the lowest fatality rate of 0.7 per 1000 cases, lower than that of Singapore.
There are some issues with the reporting of covid-19 death in Kerala. The dashboard maintained by the Department of Health, Government of Kerala provides mortality data in two tables. One table has date-wise summary confirmed cases, recoveries, active cases and deaths reported during the day (2 PM to 2 PM). The second table gives individual records of each confirmed covid-19 death. This is done after the scrutiny by a medical board consisting of clinicians and epidemiologists. This audit is undertaken within 2 to 14 days after the death. Since 28 March to 30 October 2020, 106 deaths among persons with confirmed covid-19 were excluded as the underlying cause of death was not covid-19. After the receipt of audited report, individual data of the decadents like sex, age, date of death, district and mode of transmission (travel or contact) are uploaded on the dashboard every day. Details of excluded deaths are also provided in the table.
Comparison of the daily summary of deaths and records released after audit reveals that there are more deaths in the post-audit report. See table 1 for details.
Table-1 |Differences in Crude and Corrected
Covid Death in Kerala as on 30 October 2020
| Detail | Nos |
| Deaths reported daily (crude) | 1457 |
| Excluded in audit | 106 |
| Total less excluded | 1351 |
| Total in Audited Report | 1570 |
| Excess in Audited Report | 219 |
Falling Fatality Rates
According to the audited death data, Kerala witnessed a sharp decline in CFR from 5.9 per 1000 cases during 40 Jan – 05 September to 3.1/1000 during 6 September-30 Oct 2020. See Table 2.
Table -2 : Falling Covid-19 Fatality rate in Kerala since 06 Sep 2020
| Period | Cases | Death | CFR |
| Till 5-Sep-20 | 82104 | 484 | 5.9 |
| 6 Sep – 30 Oct 20 | 343018 | 1076 | 3.1 |
Weekly summary of confirmed cases, crude and audited (corrected) deaths, and the case fatality rate (CFR) per 1000 cases are given in table 3. As the table shows, from the beginning of the pandemic till 1 August 2020, the daily (crude) reports had 81 deaths, as against 92 in the audited (corrected) reports, an excess of 11 deaths. There were such excesses during the subsequent six weeks as well. During the period 30 Jan – 05 Sep 2020, there were 147 excess deaths in the audited reports.
Table 3: Crude and Corrected Death- 30 Jan 20 – 30 Oct 20- : Covid-19 Kerala
| Week-ending | Day | Cases Weekly | Death Weekly | CFR Weekly | ||
| Crude | Corrected | Crude | Corrected | |||
| 30-Oct-20 | 275 | 39035 | 151 | 137 | 3.9 | 3.5 |
| 24-Oct-20 | 268 | 51859 | 167 | 187 | 3.2 | 3.6 |
| 17-Oct-20 | 261 | 54373 | 161 | 156 | 3.0 | 2.9 |
| 10-Oct-20 | 254 | 58522 | 165 | 158 | 2.8 | 2.7 |
| 3-Oct-20 | 247 | 53394 | 157 | 155 | 2.9 | 2.9 |
| 26-Sep-20 | 240 | 36914 | 137 | 132 | 3.7 | 3.6 |
| 19-Sep-20 | 233 | 25886 | 94 | 94 | 3.6 | 3.6 |
| 12-Sep-20 | 226 | 23035 | 88 | 67 | 4.3 | 2.9 |
| 5-Sep-20 | 219 | 10403 | 57 | 101 | 4.4 | 9.7 |
| 29-Aug-20 | 212 | 15347 | 62 | 79 | 4.0 | 5.1 |
| 22-Aug-20 | 205 | 13469 | 72 | 79 | 5.3 | 5.9 |
| 15-Aug-20 | 198 | 9765 | 40 | 78 | 4.1 | 8.0 |
| 8-Aug-20 | 191 | 8378 | 25 | 55 | 3.0 | 6.6 |
| Till 1 Aug 20 | 184 | 24742 | 81 | 92 | 3.3 | 3.7 |
| 30-Jan- 30 Oct 20 | 0-275 | 425122 | 1457 | 1570 | 3.4 | 3.7 |

Graph -2: Weekly trend in CFR- 30 Jan 20 – 31 Oct 20 : Covid-19 Kerala
The falling fatality rate may be attributed to either the change in severity of disease or the efficiency of treatment. According to my earlier analysis of a Government’s report based on the first 500 cases in Kerala, 7.2% of the patients were severe or critical. Severity classification of current caseload is not available. Since 20 August 2020, the Government of Kerala’s daily bulletin provides the number of patients in intensive care units (ICU) and on ventilator support. Table 4 below reveals that less than 1% of active patients were in the ICU and about one-fourth of the patients in ICU were on ventilators. While there is no difference in the percentage of patients in ICU, there were more patients on ventilator on 31 October 2020. The increase in active caseload, patients in ICU and on ventilator can be seen in graph 3.
Table 4: Active Cases, in ICU and on Ventilators
On 31 Aug 20 to 31 October 2020
| Outcome | 31-Aug-20 | 30-Sep-20 | 31-Oct-20 |
| Active Cases | 22512 | 72339 | 89675 |
| In ICU | 198 | 481 | 766 |
| On Ventilator | 48 | 115 | 214 |
| Percent | |||
| Percent of active patients in ICU | 0.9 | 0.7 | 0.9 |
| Percent of patients in ICU on ventilator | 24.2 | 23.9 | 27.9 |
Source: DHS Daily bulletin at http://dhs.kerala.gov.in/wp-content/uploads/2020/11/Bulletin-HFWD-English-November-01.pdf

Graph 3: Increase in Active Cases, in ICU and on Ventilators – 31 Aug to 31 to October 2020
District-wise Statistics
All districts in the State are not affected equally. While the infection rate is 12.2 in Idukki district, Thiruvananthapuram has the highest rate of 16.4 cases per 1000 people. Pathanamthitta district has the lowest CFR 0.7 per 1000 while Thiruvanathapuram with 7.2 per 1000 scores the highest.

Graph-3: Infection and Fatality rates – Covid-19 in Kerala 30-Jan- 5 Nov 2020 by Districts
Table 4: Infection, Death and Fatality Rates – 30 Jan 20- 05 Nov 2020 by Districts
| District | Population | Cases | Death | Cases/1000 People | Death/1000 People | CFR/1000 Cases |
| Pathanam thitta |
1,365,050 | 16022 | 12 | 11.7 | 0.01 | 0.7 |
| Idukki | 1,264,230 | 7796 | 9 | 6.2 | 0.01 | 1.2 |
| Kottayam | 2,250,988 | 25870 | 51 | 11.5 | 0.02 | 2.0 |
| Wayanad | 931,859 | 7591 | 15 | 8.1 | 0.02 | 2.0 |
| Palakkad | 3,203,325 | 28320 | 58 | 8.8 | 0.02 | 2.0 |
| 5 Districts | 9,015,452 | 85,599 | 145 | 9.5 | 0.02 | 1.7 |
| Kozhikode | 3,518,374 | 51944 | 147 | 14.8 | 0.04 | 2.8 |
| Malap puaram |
4,688,729 | 54766 | 159 | 11.7 | 0.03 | 2.9 |
| Alappuzha | 2,425,679 | 36092 | 109 | 14.9 | 0.04 | 3.0 |
| Thrissur | 3,558,168 | 44006 | 142 | 12.4 | 0.04 | 3.2 |
| Eranakulam | 3,741,922 | 50101 | 163 | 13.4 | 0.04 | 3.3 |
| Kollam | 3,004,328 | 36573 | 121 | 12.2 | 0.04 | 3.3 |
| Kasaragod | 1,490,408 | 19323 | 71 | 13.0 | 0.05 | 3.7 |
| Kannur | 2,876,223 | 26328 | 114 | 9.2 | 0.04 | 4.3 |
| Thiruvana nthapuram |
3,763,627 | 61734 | 442 | 16.4 | 0.12 | 7.2 |
| 9 Districts | 29,067,458 | 380,867 | 1,468 | 13.1 | 0.05 | 3.9 |
| Grand Total | 38,082,910 | 466,466 | 1613 | 12.2 | 0.04 | 3.5 |
Sex Ratio and Age
Sex-disaggregated data of Kerala’s covid-19 death is available from 16 August 2020 onwards. Since the sex-wise data of confirmed cases is not available, the gender-based risk of infection cannot be estimated. A Kasaragod based GitHub initiative has collected the gender details of the first 86,452 confirmed cases in Kerala, which shows a maleness of 62%. The maleness among 1328 covid-19 deaths in Kerala is 66.8%. This shows that women are at a lower risk of infection as well as fatality. Details in table 4. There are more women in Covid-19 Care Room of Kerala . (See graphics below)
The average age at death of Covid-19 cases in Kerala is 66 years, range 57 yrs (in Pathanamthitta district ) to 69 yrs in Ernakulam and Kottayam districts.
Table 4: Sex- Ratio : Covid-19 Cases and death – Kerala
| Gender | Cases | Death |
| Total | 86452 | 1328 |
| Female | 32920 | 441 |
| Male | 53532 | 887 |
| % Male | 61.9 | 66.8 |

Kerala’s Covid-19 Care Room Dr Remla Beevi A. (centre) with members of the Covid Cell. |

KK Shailaja Teacher, Minister of Health & Social Justice. Her interview in Vogue here |
Kerala’s the infection rate is more than twice that of India and the case fatality rate (CFR) is less than one-fourth. In Kerala, a higher infection rate was anticipated given the high outmigration and urbanization. People’s co-operation in the ‘break the chain’ campaign is the major reason for bringing the infection rate within decent levels so far. Kerala’s lower CFR has been attributed to the quality of health services. The density of health care services is the lowest in three low fatality rate districts – Palakad, Idukki and Wayanad. Globally Covid-19 CFR ranges from 1/1000 in Singapore to 100/1000 in Mexico. Within Kerala, Pathanamthitta district with a caseload of 22,000 and an infection rate of 11.7 per 1000 people has the lowest CFR of 0.7 per 1000 cases, which is even lower than Singapore’s CFR.
| Low Covid-19 CFR places – 31 Oct 20 | ||
| Country | Cases | CFR |
| Singapore | 58015 | 0.48 |
| Qatar | 132556 | 1.75 |
| Sri Lanka | 10663 | 1.88 |
| Maldives | 11659 | 3.26 |
| Kerala | 425122 | 3.70 |
| UAE | 132629 | 3.73 |
| Slovakia | 57664 | 3.8 |
| Bahrain | 81645 | 3.93 |

Kerala’s Covid efforts can become more transparent and research-friendly
The Editor of Lancet, Richard Horton in his book (The COVID-19 Catastrophe: What’s Gone Wrong and How to Stop It Happening Again) praises Kerala and New Zealand as rare successes in controlling the spread of the pandemic. (With an infection rate of 0.4 per 1000 people and CFR of 0.13 per 1000 cases on 10 November 2020, New Zealand, an island with 5 million people, is still a success story.) Kerala’s covid campaign has also received several international awards and recognitions from science journals like Nature. The covid war-rooms dash board also provides data on new tests, cases, hospital admissions and recoveries in good shape. Data on death is an exception. Since the date of death is presented in different formats, the database of 1600 deaths cannot be sorted on date and cannot be used for any analysis. The State’s Department of Health is yet to respond to an email sent a fortnight ago requesting to provide the data in a usable format.
The spreadsheet I created for this analysis may be downloaded from the here and used for reviewing this paper or for any further analysis till the Government of Kerala shares the data in a user-friendly format. The Government of Kerala’s non-user-friendly data can be seen here. (Click: view details/ACTIVE CASES IN KERALA for crude daily summary and Daily Reporting/Deaths Summary for audited death records based data).
As of now, more than half a million confirmed patients have passed through Kerala’s covid care room. This is about 1% of the cases reported globally. The fatality rate in the State has been one of the lowest in the world. Death is the only known major outcome of Covid-19. There are however reports of long term complications like chronic fatigue syndrome, also known as myalgic encephalomyelitis (ME), cardiomyopathy (stiff or thickening heart muscles), inflammation from an overactive immune system and damages to the brain and other organs.(Nature news) As over 50 million people have already been infected, it is not known if the long haul covid-19 complications are the results of SARS-Cov-2 infection or not. The researchers have only just started looking at the long tail of recovery from Covid-19. (Post-Hospitalisation COVID-19 Study).
The falling fatality rate of Covid-19 is good news. As of now, for Pathanamthritta district of Kerala, Covid-19 is just a common influenza like illness with a fatality rate of about 1 in 1000. Let us wait till the Government of Kerala shares correct data of death in a usable format before celebrating the mutation of SARS Cov-2 into a nuisance, far less lethal that its early form seen in Wuhan, Spain and Mexico.
===============
VT Padmanabhan is an epidemiologist. His teams had conducted genetic epidemiological studies among people living in high background radiation areas of Kerala, occupation health study among the workers of the Indian Rare Earths, Kochi, Kerala and Gwalior Rayons in Nagda, Madhya Pradesh and genetic studies among the children of the survivors of gas leak at the Union Carbide (now DOW chemicals) plant at Bhopal, incidence of autoimmune thyroid disorder in the neighbourhood of Madras Atomic Power Station (MAPS, Kalpakkam), near Chennai.
SIGN UP FOR COUNTERCURRENTS DAILY NEWSLETTER