Policy makers who have the important responsibility of taking decisions relating to Covid response face many difficulties. On some important issues relating to this pandemic even very senior scientists at world level do not have the same opinion. A lot of their understanding is based on their experience in the richest countries and may not be applicable in conditions of slums and villages of poorer countries. In addition in the mutations and variants of the pandemic, the changing threats have to be recognized at a proper time and decisions in accordance with this should be taken. Despite best efforts for gathering all updated information, several uncertainties remains.
In such situations it can be very helpful for improving overall response by taking steps to improve transparency and data-sharing in such ways that whatever important information in this context is available with the government can be shared very quickly with people, health personnel and organizations, scientists and institutions of decentralization. This can help the government to get the best opinion of several independent scientists very soon. This will of course be very helpful to doctors and those with a managerial role in hospitals and health systems. People who are better informed will respond better. Various institutions of decentralization, including village panchayats can respond in more evidence based ways.
To give an example of how such data-sharing can be useful, we may take the example of the data on total mortality ( or mortality by all causes ) as available in the civil registration system (CRS) where all deaths are registered. Instead of just remaining in government files for too long if this data reaches people on weekly or fortnightly basis then this can be very useful during pandemic times. In normal times this may not be so useful and people may not be so interested to look at this, but the situation changes in some special times such as those of a pandemic.
It may be argued that this is raw data and may have to be adjusted to make some corrections should the need arise. But even approximate data of this kind is useful to reveal a broad trend and the government can always issue a clarification that this is provisional data subject to future improvement.
In order to be useful, at least five year data on mortality should be easy to access for people. The average of the data for 2017, 2018 and 2019 can be used as a base or a norm with which pandemic conditions can be compared. In addition of course there should be data for 2020 and the ongoing 2021.
If for example a district finds that during April 1 to April 15 the norm on the basis of pre-Covid 3 year average is 200 deaths, but in 2020 240 deaths were recorded during this period and during the same period in 2021 this total mortality ( mortality by all causes ) went up to 400, then it can be concluded that mortality is exceeding greatly compared to the pre-Covid norm and in addition even compared to the first year of the Covid. The excess mortality here in this example is 40 in 2020 and 200 in 2021. Hence at an early stage of the sharp rise in mortality, (whether caused by a new variant of Covid or some other cause or , as is more likely, by a combination of several causes), the rise in excess mortality is known well to common people and opinion makers in the district and people become more cautious without the government having to enforce precautions on them or having to make too much effort for this.
However this quickly provided raw data is good only for conveying a rough idea of total mortality. We should not use it for other purposes like the exact cause of death as many complications are involved in this. Used for the limited purpose for which it is suitable, it can have an important role in giving timely warning and alerts leading to much better response on the part of people as well as health systems.
It may be stated by some that as the data is collected with the cooperation and help of institutions of decentralization they are already aware of this. But the reality is that they may be helping with raw data but the reliable official figure that they can use for analysis, for the latest period and for the earlier base year period, is often not available with panchayat members and so while they have some idea certainly but often they cannot give a firm estimate of excess mortality.
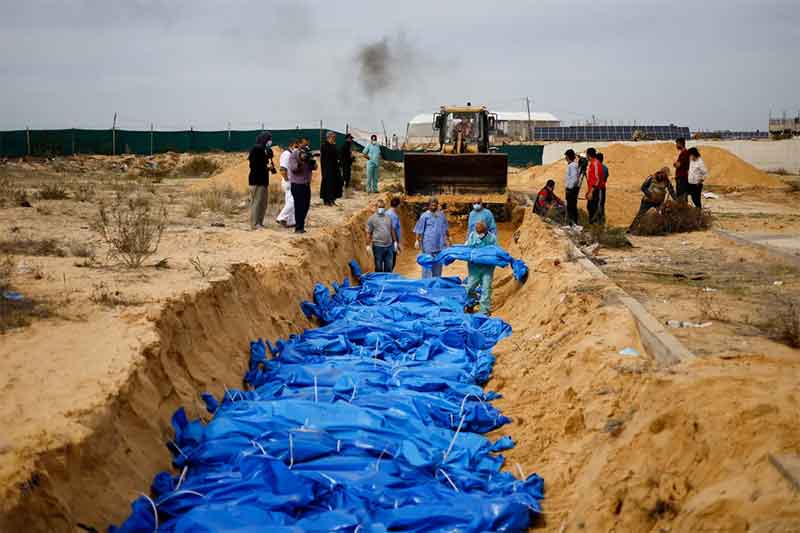
This information is particularly useful at a time of a limited period of very fast rise in total mortality, as was experienced from March to May 2021 recently in several parts of the country. The civil registration data indicates that from March 2021 onwards there is a discernible rise in mortality and by May this takes the form of real mayhem with extremely high rise in mortality being recorded in some places, as seen in terms of deaths recorded in the civil registration system. Adding the figures of five states (Bihar, Madhya Pradesh, Andhra Pradesh, Tamil Nadu and Kerala for which total mortality has been reported in the media for the first five months of 2021 and comparing it with a normal, pre-Covid year like 2019, excess total mortality of 4,60,000 or 4.6 lakh deaths has been reported. This is certainly a high figure for just five states, adding to a little over 3000 excess deaths per day in five states.
The mortality rise figures are the highest for Madhya Pradesh and Andhra Pradesh, peaking in May. In Madhya Pradesh, for instance, the number of deaths recorded in CRS in May 2021 has been between 4 to 5 times more than what was the norm during this month in the previous 3 years ( around 160,000 compared to around 31,000 ). If we see the figures from the beginning of 2021 then we see that mortality figures have still increased very considerably compared to norm ( approximately double of the norm ) but in May there is absolute mayhem. In the case of Andhra Pradesh again a 4 to 5 fold increase in total mortality has been reported in May.
In the case of Gujarat the CRS data for this state for a period of 71 days from March 1 to May 10 2021 indicates that the total mortality during this period was about double compared to the previous year.
This CRS data for MP and Gujarat was first highlighted by Bhaskar ( Hindi) and Divya Bhaskar ( Gujarati) newspapers respectively. One response for Gujarat from government has been that some deaths may have been recorded more than once. Other analysts have argued that the base figure in Gujarat should have been higher for purpose of comparison , but even with this change a 50% rise was reported.
Then there is the additional problem created by the scams relating to issue of fake death certificates which are just now much in news in Haryana but at other times have also been reported from other states like Maharashtra and Madhya Pradesh. Could these be inflating the mortality data in some states?
On the whole, however, there is enough indication of May mayhem being a reality and this situation should be carefully analyzed for its policy implications. These excess deaths are likely to be caused by a mix of several factors but only more detailed data and rigorous analysis will reveal the precise contribution of various factors at play.
Moreover there are several other curious aspects which have not been explained properly. It was reported some time back that the total mortality in Kerala in 2020 has been recorded to be lower than in 2019. This was initially related to the success of Kerala in keeping down Covid cases, its overall much better health system and the near absence of road accidents in lockdown times. However the last word has not been said on aspects like accidents in several places as some others accidents involving migrant workers travelling or walking in difficult conditions, as well as domestic accidents may have increased.
Still more difficult to understand is the reported decrease in mortality in Gujarat in 2020. The recently published data for 11 month period January to November says that the death certification based mortality data for Gujarat shows 3.93 lakh ( one million=10 lakh) deaths in 2018, 4.19 lakh deaths in 2019 but much lesser, about 11 per cent less, deaths in 2020 at 3.74 lakh.
So there are many unexplained aspects of the data available at present. If some big increases need to be explained, some declines also need better explanation.
However this much can certainly be stated that if the data of fast increasing phase had become available much earlier on the basis of government sharing data per week or per fortnight, then a timely and useful warning, with disaggregated data for various panchayats, districts, towns and cities would have been available much earlier and this would have prompted more and better actions to check the escalating trend. However it is still not too late to introduce such a data-sharing system which can play a very useful role in future.
Bharat Dogra is a journalist and author. His recent books include Planet In Peril and Man Over Machine.
GET COUNTERCURRENTS DAILY NEWSLETTER STRAIGHT TO YOUR INBOX


