The Intergovernmental Panel on Climate Change (IPCC) has released a very large, detailed and important document “Climate Change 2021. The physical science basis” that is prefaced by a detailed Summary for Policymakers (SPM) . Set out below for the benefit of busy readers is a summary and critique of this summary. In short, the SPM superbly sets out the science of the shocking and worsening climate crisis but significantly fails when it comes to setting out urgently required policy prescriptions
“Climate Change 2021. The physical science basis. Summary for Policymakers” by the Intergovernmental Panel on Climate Change (IPCC) [1] is the summary of the Working Group 1 contribution to the Sixth Assessment report of the IPCC (AR6).
For simplicity I will refer to this as SPM. The IPCC reports represent a conservative consensus from scientists of numerous different countries and make for difficult reading because so many of their statements are qualified by detailed references and probabilistic phrases such as ‘very likely”, “high confidence” and “medium confidence”. Accordingly, set out below is a Summary of the 2021 Summary for Policymakers (SPM) that will serve as a useful and readable reference for concerned people.
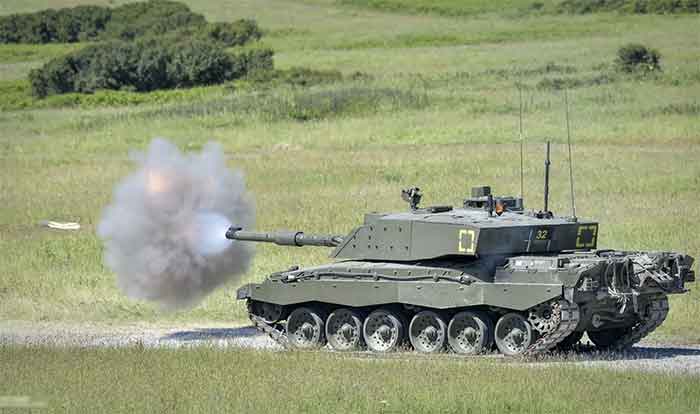
I approached this “Summary of a Summary” from a realistically pessimistic stance from my perspective as a biological chemist seriously concerned about speciescide, ecocide and limits to growth for 60 years and about the existential threat of climate change to Humanity and the Biosphere for 30 years. Thus in 2021 I published a huge 845 page book entitled “ Climate Crisis, Climate Genocide & Solutions” [2, 3] that commences with a quote from eminent theoretical physicist and cosmologist Stephen Hawking about the key existential threats to Humanity and the Biosphere from nuclear weapons and climate change (my emphasis in bold): “We see great peril if governments and societies do not take action now to render nuclear weapons obsolete and to prevent further climate change” [4]. My huge book concludes: “At the present plus 1.0-1.2 C the World is being savaged by deadly high temperatures and global warming-exacerbated droughts, floods, forest fires, high energy intensity tropical storms, sea level rise, storm surges, massive ecosystem loss and irreversible Biodiversity loss. A plus 1.5C is inevitable in the coming decade and in the face of remorselessly increasing CO2 and CH4 in the atmosphere one concludes that a catastrophic plus 2C is effectively unavoidable. Nevertheless we are inescapably obliged to do everything we can to make the future “less bad” for our children, our grandchildren and future generations” [2]. My “Summary of the IPCC Summary” can be read in the light of that scientific and personal perspective (I have 3 children and 3 grandchildren).
My Summary of the Summary for Policymakers (SPM) simply takes the form of key quotations from successive sections of the SPM [a few amplifying comments are added in square brackets].
“Introduction
This SPM provides a high-level summary of the understanding of the current state of the climate, including how it is changing and the role of human influence, the state of knowledge about possible climate futures, climate information relevant to regions and sectors, and limiting human-induced climate change.
A) The Current State of the Climate
A.1 It is unequivocal that human influence has warmed the atmosphere, ocean and land. Widespread and rapid changes in the atmosphere, ocean, cryosphere and biosphere have occurred.
A.1.1 Observed increases in well-mixed greenhouse gas (GHG) concentrations since around 1750 are unequivocally caused by human activities. Since 2011 (measurements reported in AR5), concentrations have continued to increase in the atmosphere, reaching annual averages of 410 ppm for carbon dioxide (CO2), 1866 ppb for methane (CH4), and 332 ppb for nitrous oxide (N2O) in 2019. Land and ocean have taken up a near-constant proportion (globally about 56% per year) of CO2 emissions from human activities over the past six decades.
A.1.2 Each of the last four decades has been successively warmer than any decade that preceded it since 1850. Global surface temperature in the first two decades of the 21st century (2001-2020) was 0.99 [0.84-1.10] °C higher than 1850-1900.
A.1.3 The likely range of total human-caused global surface temperature increase from 1850–1900 to 2010–2019 is 0.8°C to 1.3°C, with a best estimate of 1.07°C… It is very likely that well-mixed GHGs were the main driver of tropospheric warming since 1979, and extremely likely that human-caused stratospheric ozone depletion was the main driver of cooling of the lower stratosphere between 1979 and the mid-1990s.
A.1.4 Globally averaged precipitation over land has likely increased since 1950, with a faster rate of increase since the 1980s (medium confidence). It is likely that human influence contributed to the pattern of observed precipitation changes since the mid-20th century, and extremely likely that human influence contributed to the pattern of observed changes in near-surface ocean salinity.
A.1.5 Human influence is very likely the main driver of the global retreat of glaciers since the 1990s and the decrease in Arctic sea ice area between 1979–1988 and 2010–2019 (about 40% in September and about 10% in March).
A.1.6 It is virtually certain that the global upper ocean (0–700 m) has warmed since the 1970s and extremely likely that human influence is the main driver. It is virtually certain that human-caused CO2 emissions are the main driver of current global acidification of the surface open ocean. There is high confidence that oxygen levels have dropped in many upper ocean regions since the mid-20th century, and medium confidence that human influence contributed to this drop.
A.1.7 Global mean sea level increased by 0.20 [0.15 to 0.25] m between 1901 and 2018.
A.1.8 Changes in the land biosphere since 1970 are consistent with global warming: climate zones have shifted poleward in both hemispheres, and the growing season has on average lengthened by up to two days per decade since the 1950s in the Northern Hemisphere extratropics.
Fig. 1 Warming is unprecedented in more than 2000 years… Warmest multi-century period in more than 100,000 years.
Fig. 2 Observed warming is driven by emissions from human activities, with greenhouse gas warming partly masked by [SO2-derived] aerosol cooling.
A.2 The scale of recent changes across the climate system as a whole and the present state of many aspects of the climate system are unprecedented over many centuries to many thousands of years.
A.2.1 In 2019, atmospheric CO2 concentrations were higher than at any time in at least 2 million years… concentrations of CH4 and N2O were higher than at any time in at least 800,000 years
A.2.2 Global surface temperature has increased faster since 1970 than in any other 50-year period over at least the last 2000 years… Prior to that, the next most recent warm period was about 125,000 years ago.
A.2.3 In 2011–2020, annual average Arctic sea ice area reached its lowest level since at least 1850… The global nature of glacier retreat, with almost all of the world’s glaciers retreating synchronously, since the 1950s is unprecedented in at least the last 2000 years.
A.2.4 Global mean sea level has risen faster since 1900 than over any preceding century in at least the last 3000 years.
A.3 Human-induced climate change is already affecting many weather and climate extremes in every region across the globe. Evidence of observed changes in extremes such as heatwaves, heavy precipitation, droughts, and tropical cyclones, and, in particular, their attribution to human influence, has strengthened since AR5.
A.3.1 It is virtually certain that hot extremes (including heatwaves) have become more frequent and more intense across most land regions since the 1950s, while cold extremes (including cold waves) have become less frequent and less severe.
A.3.2 The frequency and intensity of heavy precipitation events have increased since the 1950s over most land area for which observational data are sufficient for trend analysis.
A.3.3 Decreases in global land monsoon precipitation from the 1950s to the 1980s are partly attributed to human-caused Northern Hemisphere aerosol emissions, but increases since then have resulted from rising GHG concentrations and decadal to multi-decadal internal variability.
A.3.4 It is likely that the global proportion of major (Category 3–5) tropical cyclone occurrence has increased over the last four decades, and the latitude where tropical cyclones in the western North Pacific reach their peak intensity has shifted northward; these changes cannot be explained by internal variability alone.
A.3.5 Human influence has likely increased the chance of compound extreme events since the 1950s. This includes increases in the frequency of concurrent heatwaves and droughts on the global scale (high confidence); fire weather in some regions of all inhabited continents (medium confidence); and compound flooding in some locations.
Fig. 3 Climate change is already affecting every inhabited region across the globe with human influence contributing to many observed changes in weather and climate extremes.
A.4 Improved knowledge of climate processes, paleoclimate evidence and the response of the climate system to increasing radiative forcing gives a best estimate of equilibrium climate sensitivity of 3°C [increase from doubling of atmospheric GHG].
A.4.3 Heating of the climate system has caused global mean sea level rise through ice loss on land and thermal expansion from ocean warming. Thermal expansion explained 50% of sea level rise during 1971–2018, while ice loss from glaciers contributed 22%, ice sheets 20% and changes in land water storage 8%.
B) Possible Climate Futures.
Fig. 4 Future emissions cause future additional warming, with total warming dominated by past and future CO₂ emissions.
B.1 Global surface temperature will continue to increase until at least the mid-century under all emissions scenarios considered. Global warming of 1.5°C and 2°C will be exceeded during the 21st century unless deep reductions in CO2 and other greenhouse gas emissions occur in the coming decades.
B.1.1 Compared to 1850–1900, global surface temperature averaged over 2081–2100 is very likely to be higher by 1.0°C to 1.8°C under the very low GHG emissions scenario considered (SSP1-1.9), by 2.1°C to 3.5°C in the intermediate scenario (SSP2-4.5) and by 3.3°C to 5.7°C under the very high GHG emissions scenario (SSP5-8.5). The last time global surface temperature was sustained at or above 2.5°C higher than 1850–1900 was over 3 million years ago.
Table 1 Changes in global surface temperature, which are assessed based on multiple lines of evidence, for selected 20-year time periods and the five illustrative emissions scenarios considered [we are presently on the highest emissions scenario].
B.1.2 Based on the assessment of multiple lines of evidence, global warming of 2°C, relative to 1850–1900, would be exceeded during the 21st century under the high and very high GHG emissions scenarios considered in this report (SSP3-7.0 and SSP5-8.5, respectively) [we are presently on the highest emissions scenario].
B.1.3 Global warming of 1.5°C relative to 1850-1900 would be exceeded during the 21st century under the intermediate, high and very high scenarios considered in this report (SSP2-4.5, SSP3-7.0 and SSP5-8.5, respectively) [we are presently on the highest emissions scenario].
B.1.4 Global surface temperature in any single year can vary above or below the long-term human-induced trend, due to substantial natural variability [e.g. due to COVID-19-induced economic downturn, vulcanism, El Nino].
B.2 Many changes in the climate system become larger in direct relation to increasing global warming. They include increases in the frequency and intensity of hot extremes, marine heatwaves, and heavy precipitation, agricultural and ecological droughts in some regions, and proportion of intense tropical cyclones, as well as reductions in Arctic sea ice, snow cover and permafrost.
B.2.1 It is virtually certain that the land surface will continue to warm more than the ocean surface (likely 1.4 to 1.7 times more). It is virtually certain that the Arctic will continue to warm more than global surface temperature, with high confidence above two times the rate of global warming.
B.2.2 With every additional increment of global warming, changes in extremes continue to become larger. For example, every additional 0.5°C of global warming causes clearly discernible increases in the intensity and frequency of hot extremes, including heatwaves (very likely), and heavy precipitation (high confidence), as well as agricultural and ecological droughts in some regions (high confidence). Discernible changes in intensity and frequency of meteorological droughts, with more regions showing increases than decreases, are seen in some regions for every additional 0.5°C of global warming.
B.2.3 Some mid-latitude and semi-arid regions, and the South American Monsoon region, are projected to see the highest increase in the temperature of the hottest days, at about 1.5 to 2 times the rate of global warming.
B.2.4 It is very likely that heavy precipitation events will intensify and become more frequent in most regions with additional global warming. At the global scale, extreme daily precipitation events are projected to intensify by about 7% for each 1°C of global warming (high confidence). The proportion of intense tropical cyclones (categories 4-5) and peak wind speeds of the most intense tropical cyclones are projected to increase at the global scale with increasing global warming.
B.2.5 Additional warming is projected to further amplify permafrost thawing, and loss of seasonal snow cover, of land ice and of Arctic sea ice (high confidence). The Arctic is likely to be practically sea ice free in September at least once before 2050 under the five illustrative scenarios considered in this report, with more frequent occurrences for higher warming levels. There is low confidence in the projected decrease of Antarctic sea ice.
Fig. 5 With every increment of global warming, changes get larger in regional mean temperature, precipitation and soil moisture.
Fig. 6 Projected changes in extremes are larger in frequency and intensity with every additional increment of global warming [Hot temperature extremes over land, heavy precipitation over land, and agricultural and ecological droughts in drying regions are already significantly worse].
B.3 Continued global warming is projected to further intensify the global water cycle, including its variability, global monsoon precipitation and the severity of wet and dry events.
B.3.1 There is strengthened evidence since AR5 that the global water cycle will continue to intensify as global temperatures rise (high confidence), with precipitation and surface water flows projected to become more variable over most land regions within seasons (high confidence) and from year to year.
B.3.2 A warmer climate will intensify very wet and very dry weather and climate events and seasons, with implications for flooding or drought (high confidence), but the location and frequency of these events depend on projected changes in regional atmospheric circulation, including monsoons and mid-latitude storm tracks. It is very likely that rainfall variability related to the El Niño–Southern Oscillation is projected to be amplified by the second half of the 21st century.
B.3.4 A projected southward shift and intensification of Southern Hemisphere summer mid-latitude storm tracks and associated precipitation is likely in the long term under high GHG emissions scenarios (SSP3-7.0,SSP5-8.5), but in the near term the effect of stratospheric ozone recovery counteracts these changes.
B.4 Under scenarios with increasing CO2 emissions, the ocean and land carbon sinks are projected to be less effective at slowing the accumulation of CO2 in the atmosphere.
B.4.1 While natural land and ocean carbon sinks are projected to take up, in absolute terms, a progressively larger amount of CO2 under higher compared to lower CO2 emissions scenarios, they become less effective, that is, the proportion of emissions taken up by land and ocean decrease with increasing cumulative CO2 emissions. This is projected to result in a higher proportion of emitted CO2 remaining in the atmosphere.
B.4.2 Based on model projections, under the intermediate scenario that stabilizes atmospheric CO2 concentrations this century (SSP2-4.5), the rates of CO2 taken up by the land and oceans are projected to decrease in the second half of the 21st century.
B.4.3 The magnitude of feedbacks between climate change and the carbon cycle becomes larger but also more uncertain in high CO2 emissions scenarios (very high confidence). However, climate model projections show that the uncertainties in atmospheric CO2 concentrations by 2100 are dominated by the differences between emissions scenarios (high confidence). Additional ecosystem responses to warming not yet fully included in climate models, such as CO2 and CH4 fluxes from wetlands, permafrost thaw and wildfires, would further increase concentrations of these gases in the atmosphere.
Fig. 7 The proportion of CO₂ emissions taken up by land and ocean carbon sinks is smaller in scenarios with higher cumulative CO₂ emissions.
B.5 Many changes due to past and future greenhouse gas emissions are irreversible for centuries to millennia, especially changes in the ocean, ice sheets and global sea level.
B.5.1 Past GHG emissions since 1750 have committed the global ocean to future warming (high confidence). Over the rest of the 21st century, likely ocean warming ranges from 2–4 (SSP1-2.6) to 4–8 times (SSP5-8.5) the 1971–2018 change. Based on multiple lines of evidence, upper ocean stratification (virtually certain), ocean acidification (virtually certain) and ocean deoxygenation (high confidence) will continue to increase in the 21st century, at rates dependent on future emissions. Changes are irreversible on centennial to millennial time scales in global ocean temperature.
B.5.2 Mountain and polar glaciers are committed to continue melting for decades or centuries (very high confidence). Loss of permafrost carbon following permafrost thaw is irreversible at centennial timescales (high confidence). Continued ice loss over the 21st century is virtually certain for the Greenland Ice Sheet and likely for the Antarctic Ice Sheet. There is high confidence that total ice loss from the Greenland Ice Sheet will increase with cumulative emissions.
B.5.3 It is virtually certain that global mean sea level will continue to rise over the 21st century. Relative to 1995-2014, the likely global mean sea level rise by 2100 is 0.28-0.55 m under the very low GHG emissions scenario (SSP1-1.9), 0.32-0.62 m under the low GHG emissions scenario (SSP1-2.6), 0.44-0.76 m under the intermediate GHG emissions scenario (SSP2-4.5), and 0.63-1.01 m under the very high GHG emissions scenario (SSP5-8.5.)
B.5.4 In the longer term, sea level is committed to rise for centuries to millennia due to continuing deep ocean warming and ice sheet melt, and will remain elevated for thousands of years (high confidence). Over the next 2000 years, global mean sea level will rise by about 2 to 3 m if warming is limited to 1.5°C, 2 to 6m if limited to 2°C and 19 to 22 m with 5°C of warming, and it will continue to rise over subsequent millennia.
Fig. 8. Human activities affect all the major climate system components, with some responding over decades and others over centuries [e.g. with worst case by 2100 in brackets: Global surface temperature change relative to 1850-1900 (+4.80C) , September Arctic sea ice area (practically ice-free by 2060), Global ocean surface pH (a measure of acidity)(down to pH 7.67), Global mean sea level change relative to 1900 (+ 1.75 metres)].
C) Climate Information for Risk Assessment and Regional Adaptation
C.1 Natural drivers and internal variability will modulate human-caused changes, especially at regional scales and in the near term, with little effect on centennial global warming. These modulations are important to consider in planning for the full range of possible changes.
C.1.1 The historical global surface temperature record highlights that decadal variability has enhanced and masked underlying human-caused long-term changes, and this variability will continue into the future.
C.1.2 Projected human caused changes in mean climate and climatic impact-drivers (CIDs), including extremes, will be either amplified or attenuated by internal variability.
C.1.3 Internal variability has largely been responsible for the amplification and attenuation of the observed human-caused decadal-to-multi-decadal mean precipitation changes in many land regions.
C.1.4 Based on paleoclimate and historical evidence, it is likely that at least one large explosive volcanic eruption would occur during the 21st century. Such an eruption would reduce global surface temperature and precipitation, especially over land, for one to three years, alter the global monsoon circulation, modify extreme precipitation and change many CIDs.
C.2 With further global warming, every region is projected to increasingly experience concurrent and multiple changes in climatic impact-drivers. Changes in several climatic impact-drivers would be more widespread at 2°C compared to 1.5°C global warming and even more widespread and/or pronounced for higher warming levels.
C.2.1 All regions are projected to experience further increases in hot climatic impact-drivers (CIDs) and decreases in cold CIDs.
C.2.2 At 1.5°C global warming, heavy precipitation and associated flooding are projected to intensify and be more frequent in most regions in Africa and Asia (high confidence), North America (medium to high confidence) and Europe (medium confidence). Also, more frequent and/or severe agricultural and ecological droughts are projected in a few regions in all continents except Asia compared to 1850–1900.
C.2.3 At 2°C global warming and above, the level of confidence in and the magnitude of the change in droughts and heavy and mean precipitation increase compared to those at 1.5°C. Heavy precipitation and associated flooding events are projected to become more intense and frequent in the Pacific Islands and across many regions of North America and Europe (medium to high confidence). These changes are also seen in some regions in Australasia and Central and South America (medium confidence). Several regions in Africa, South America and Europe are projected to experience an increase in frequency and/or severity of agricultural and ecological droughts with medium to high confidence; increases are also projected in Australasia, Central and North America, and the Caribbean with medium confidence. A small number of regions in Africa, Australasia, Europe and North America are also projected to be affected by increases in hydrological droughts, and several regions are projected to be affected by increases or decreases in meteorological droughts with more regions displaying an increase.
C.2.4 More CIDs across more regions are projected to change at 2°C and above compared to 1.5°C global warming (high confidence). Region-specific changes include intensification of tropical cyclones and/or extratropical storms (medium confidence), increases in river floods (medium to high confidence), reductions in mean precipitation and increases in aridity (medium to high confidence), and increases in fire weather (medium to high confidence).
C.2.5 It is very likely to virtually certain that regional mean relative sea level rise will continue throughout the 21st century, except in a few regions with substantial geologic land uplift rates. Approximately two-thirds of the global coastline has a projected regional relative sea level rise within ±20% of the global mean increase (medium confidence). Due to relative sea level rise, extreme sea level events that occurred once per century in the recent past are projected to occur at least annually at more than half of all tide gauge locations by 2100 (high confidence).
C.2.6 Cities intensify human-induced warming locally, and further urbanization together with more frequent hot extremes will increase the severity of heatwaves (very high confidence). Urbanization also increases mean and heavy precipitation over and/or downwind of cities (medium confidence) and resulting runoff intensity (high confidence). In coastal cities, the combination of more frequent extreme sea level events (due to sea level rise and storm surge) and extreme rainfall/river flow events will make flooding more probable (high confidence).
C.2.7 Many regions are projected to experience an increase in the probability of compound events with higher global warming (high confidence). In particular, concurrent heatwaves and droughts are likely to become more frequent. Concurrent extremes at multiple locations become more frequent, including in crop-producing areas, at 2°C and above compared to 1.5°C global warming (high confidence).
Fig. 9 Multiple climatic impact-drivers are projected to change in all regions of the world. Climatic impact-drivers (CIDs) are physical climate system conditions (e.g., means, events, extremes) that affect an element of society or ecosystems. Depending on system tolerance, CIDs and their changes can be detrimental, beneficial, neutral, or a mixture of each across interacting system elements and regions.
C.3 Low-likelihood outcomes, such as ice sheet collapse, abrupt ocean circulation changes, some compound extreme events and warming substantially larger than the assessed very likely range of future warming cannot be ruled out and are part of risk assessment.
C.3.1 If global warming exceeds the assessed very likely range for a given GHG emissions scenario, including low GHG emissions scenarios, global and regional changes in many aspects of the climate system, such as regional precipitation and other CIDs, would also exceed their assessed very likely ranges (high confidence). Such low-likelihood high-warming outcomes are associated with potentially very large impacts, such as through more intense and more frequent heatwaves and heavy precipitation, and high risks for human and ecological systems particularly for high GHG emissions scenarios.
C.3.2 Low-likelihood, high-impact outcomes could occur at global and regional scales even for global warming within the very likely range for a given GHG emissions scenario. The probability of low-likelihood, high impact outcomes increases with higher global warming levels (high confidence). Abrupt responses and tipping points of the climate system, such as strongly increased Antarctic ice sheet melt and forest dieback, cannot be ruled out (high confidence).
C.3.3 If global warming increases, some compound extreme events with low likelihood in past and current climate will become more frequent, and there will be a higher likelihood that events with increased intensities, durations and/or spatial extents unprecedented in the observational record will occur (high confidence).
C.3.4 The Atlantic Meridional Overturning Circulation [AMOC] is very likely to weaken over the 21st century for all emission scenarios. While there is high confidence in the 21st century decline, there is only low confidence in the magnitude of the trend. There is medium confidence that there will not be an abrupt collapse before 2100. If such a collapse were to occur, it would very likely cause abrupt shifts in regional weather patterns and water cycle, such as a southward shift in the tropical rain belt, weakening of the African and Asian monsoons and strengthening of Southern Hemisphere monsoons, and drying in Europe.
C.3.5 Unpredictable and rare natural events not related to human influence on climate may lead to low-likelihood, high impact outcomes. For example, a sequence of large explosive volcanic eruptions within decades has occurred in the past, causing substantial global and regional climate perturbations over several decades. Such events cannot be ruled out in the future, but due to their inherent unpredictability they are not.
included
D) Limiting Future Climate Change
D.1 From a physical science perspective, limiting human-induced global warming to a specific level requires limiting cumulative CO2 emissions, reaching at least net zero CO2 emissions, along with strong reductions in other greenhouse gas emissions. Strong, rapid and sustained reductions in CH4 emissions would also limit the warming effect resulting from declining aerosol pollution and would improve air quality.
D.1.1 This Report reaffirms with high confidence the AR5 finding that there is a near-linear relationship between cumulative anthropogenic CO2 emissions and the global warming they cause. Each 1000 GtCO2 of cumulative CO2 emissions is assessed to likely cause a 0.27°C to 0.63°C increase in global surface temperature with a best estimate of 0.45°C.
Fig. 10 Every tonne of CO₂ emissions adds to global warming – The near linear relationship between the cumulative CO₂ emissions and global warming for five illustrative scenarios until year 2050.
D.1.2 Over the period 1850–2019, a total of 2390 ± 240 (likely range) GtCO2 of anthropogenic CO2 was emitted. Remaining carbon budgets have been estimated for several global temperature limits and various levels of probability.
Table 2 Estimates of historical CO2 emissions and remaining carbon budgets [e.g. a carbon budget from January 2020 of only 900 Gt CO2 for a probability of avoiding +2C of 83% – would you get on a plane with a 17% chance of crashing?]
D.1.3 Several factors that determine estimates of the remaining carbon budget have been re-assessed, and updates to these factors since SR1.5 are small.
D.1.4 Anthropogenic CO2 removal (CDR) has the potential to remove CO2 from the atmosphere and durably store it in reservoirs (high confidence). CDR aims to compensate for residual emissions to reach net zero CO2 or net zero GHG emissions or, if implemented at a scale where anthropogenic removals exceed anthropogenic emissions, to lower surface temperature.
D.1.5 Anthropogenic CO2 removal (CDR) leading to global net negative emissions would lower the atmospheric CO2 concentration and reverse surface ocean acidification (high confidence). Anthropogenic CO2 removals and emissions are partially compensated by CO2 release and uptake respectively, from or to land and ocean carbon pools.
D.1.6 If global net negative CO2 emissions were to be achieved and be sustained, the global CO2-induced surface temperature increase would be gradually reversed but other climate changes would continue in their current direction for decades to millennia (high confidence). For instance, it would take several centuries to millennia for global mean sea level to reverse course even under large net negative CO2 emissions (high confidence).
D.1.7 In the five illustrative scenarios, simultaneous changes in CH4, aerosol and ozone precursor emissions, that also contribute to air pollution, lead to a net global surface warming in the near and long-term (high confidence). In the long term, this net warming is lower in scenarios assuming air pollution controls combined with strong and sustained CH4 emission reductions (high confidence). In the low and very low GHG emissions scenarios, assumed reductions in anthropogenic aerosol emissions lead to a net warming, while reductions in CH4 and other ozone precursor emissions lead to a net cooling. Because of the short lifetime of both CH4 and aerosols, these climate effects partially counterbalance each other and reductions in CH4 emissions also contribute to improved air quality by reducing global surface ozone (high confidence).
D.1.8 Achieving global net zero CO2 emissions is a requirement for stabilizing CO2-induced global surface temperature increase, with anthropogenic CO2 emissions balanced by anthropogenic removals of CO2. This is different from achieving net zero GHG emissions, where metric-weighted anthropogenic GHG emissions equal metric-weighted anthropogenic GHG removals. For a given GHG emission pathway, the pathways of individual greenhouse gases determine the resulting climate response.
D.2 Scenarios with very low or low GHG emissions (SSP1-1.9 and SSP1-2.6) lead within years to discernible effects on greenhouse gas and aerosol concentrations, and air quality, relative to high and very high GHG emissions scenarios (SSP3-7.0 or SSP5-8.5). Under these contrasting scenarios, discernible differences in trends of global surface temperature would begin to emerge from natural variability within around 20 years, and over longer time periods for many other climatic impact-drivers (high confidence).
D.2.1 Emissions reductions in 2020 associated with measures to reduce the spread of COVID-19 led to temporary but detectible effects on air pollution (high confidence), and an associated small, temporary increase in total radiative forcing, primarily due to reductions in cooling caused by aerosols arising from human activities (medium confidence).
D.2.2 Reductions in GHG emissions also lead to air quality improvements. However, in the near term, even in scenarios with strong reduction of GHGs, as in the low and very low GHG emission scenarios (SSP1-2.6 and SSP1-1.9), these improvements are not sufficient in many polluted regions to achieve air quality guidelines specified by the World Health Organization (high confidence).
D.2.3 Scenarios with very low or low GHG emissions (SSP1-1.9 and SSP1-2.6) would have rapid and sustained effects to limit human-caused climate change, compared with scenarios with high or very high GHG emissions (SSP3-7.0 or SSP5-8.5), but early responses of the climate system can be masked by natural variability.
D.2.4 Scenarios with very low and low GHG emissions (SSP1-1.9 and SSP1-2.6) would lead to substantially smaller changes in a range of CIDs beyond 2040 than under high and very high GHG emissions scenarios (SSP3-7.0 and SSP5-8.5).”
Conclusions – Summary of the Summary of the SPM Summary.
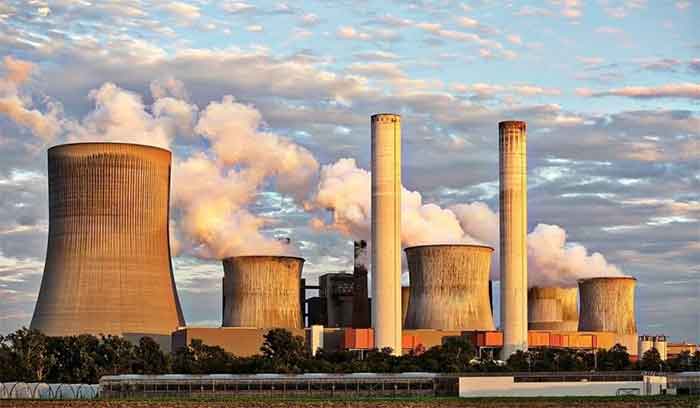
Overall the conservative and consensus Summary for Policymakers (SPM) [1] reveals little new for people closely following man-made climate change (e.g. see [2, 3]), but critically declares high certitude (“high confidence”) in many areas obfuscated by powerful, highly polluting corporations (e.g. fossil fuel corporations), climate criminal, neoliberal politicians (e.g. America’s Donald Trump, Australia’s Scott Morrison and Brazil’s Jair Bolsonaro) and complicit, mendacious and climate change denialist or effective climate change denialist Mainstream media (e.g. the disgraceful Anglosphere Murdoch media empire that is effective climate change denialist through relentlessly continuing to promote climate change inaction). Some of the key findings are summarized below:
(A). The present worsening climate change is real, man-made, huge, exceptional, threatening, and associated with elevated atmospheric greenhouse gas (GHG) levels without precedent for millions of years.
(B). The manifold consequences of man-made climate change include increased intensity of tropical storms, precipitation, glacier melting, tundra melting, Arctic sea ice loss, drought, forest fires, storm surges through sea level rise, agricultural loss, frequency and intensity of hot extremes, marine heatwaves and increased atmospheric CO2 (from decreased ability of ocean and forest sinks to absorb CO2). Changes to key ocean currents (e.g. the Atlantic Meridional Overturning Circulation, AMOC) and monsoons will have a devastating impact on Humanity, as will irreversible exceedance of key tipping points (e.g. loss from Antarctic ice sheets). The Arctic summer sea ice is predicted to be gone by 2060 (with the consequent “albedo flip” from sunlight reflecting ice and snow to sunlight absorbing sea providing a positive feedback loop for more global warming).
(C). The regional impacts worsen as the temperature increase goes from 1.5°C to 2.0°C of global warming. At 1.5°C global warming heavy precipitation, and flooding are projected to intensify and be more frequent world-wide. At 2°C of global warming heavy precipitation, flooding and agricultural and ecological droughts further worsen in particular regions.
(D). The final section addresses limiting future climate change, and the need for “zero net emissions” though cutting emissions and removal of CO2 from the atmosphere (that would also lower ocean acidification that threatens coral and other organisms with a calcareous exoskeleton). Importantly it states that (a) there is a near-linear relationship between cumulative anthropogenic CO2 emissions and the global warming they cause, (b) “each 1000 GtCO2 of cumulative CO2 emissions is assessed to likely cause a 0.27°C to 0.63°C increase in global surface temperature with a best estimate of 0.45°C” and (c) that there is a remaining “carbon budget” from January 2020 of only 900 Gt CO2 for an 83% probability of avoiding +2°C (Table 2).
A 2009 revised estimate of annual global GHG emissions (properly taking land-use into account) is 63.8 Gt CO2-equivalent per year [5] and this has increased by about 20% to 76.6 Gt CO2-equivalent per year in the last decade [6]. Accordingly re (b) it would take 1000 Gt CO2 / 76.6 Gt CO2-equivalent per year = 13.1 or about 13 years to reach 1.55°C. Similarly re (c), it would take 900/ 76.6 = 11.7 or only about 12 years to use up the 900 Gt CO2 “carbon budget” for an 83% probability of avoiding a catastrophic +2°C – would you board a plane that had a 17% chance of crashing? Massive action over the next dozen years will be crucial for avoiding a catastrophic +2C°C.
Some key, Elephant in the Room matters were insufficiently alluded to or absent from the IPCC SPM, specifically:
(a). A dozen years left to act. As set out in (D) above, (a) warming is linearly related to carbon emissions, and under the present “business as usual”, (b) it will take a dozen years to reach the limit of 1.5C , and (c) it will take a dozen years to use up the remaining “carbon budget” for a 83% probability of avoiding a catastrophic +2C of warming. Yet fossil fuel consumption increased by about 20% over the last decade and, while coal use has flattened out, oil and gas use is still increasing [6].
(b). Carbon Price, inescapable Carbon Debt and intergenerational injustice. From 2 different expert approaches it has been determined that the damage-related Carbon Price is about $200 per tonne CO2-equivalent but the IMF has determined that the global average applied Carbon Price is only a miniscule $2 per tonne CO2-equivalent. There is an inescapable Carbon Debt being left for future generations that presently totals $250 trillion and is increasing at $15 trillion per year. This Carbon Debt is inescapable if Humanity rejects living in an irreversibly degraded world e.g. coastal cities and agricultural land will be inundated unless horrendously expensive sea walls are built.
(c). At +1.1C extremely damaging global warming has already arrived for many ecosystems and many countries. At a present global warming of +1.1C, tropical island nations and tropical mega-delta countries are now frequently devastated by high intensity hurricanes with accompanying storm surges (e.g. Caribbean, Indian Ocean and Pacific Island nations, the US, India, and Bangladesh), drought afflicts semi-desert countries (e.g. in the Sahel), Mediterranean-climate countries are suffering frequent and devastating high intensity forest fires (Western US, southern Europe, North Africa, South America, Turkey, Australia), and there are exceptionally huge boreal forest fires (US, Canada, Russia), deadly heat waves, and exceptional flooding events which are occurring throughout the world.
(d). Biodiversity loss. The species extinction rate in our present Anthropocene Era is 100-1,000 times greater than normal. Words fail to describe the utter evil and cruelty of this in relation to future generations. Economic value aside (e.g. crucial pollination, drug discovery [7]), every species and ecosystem is priceless. We cannot destroy what we cannot replace. Demolish the Taj Mahal for a motor car racing circuit?
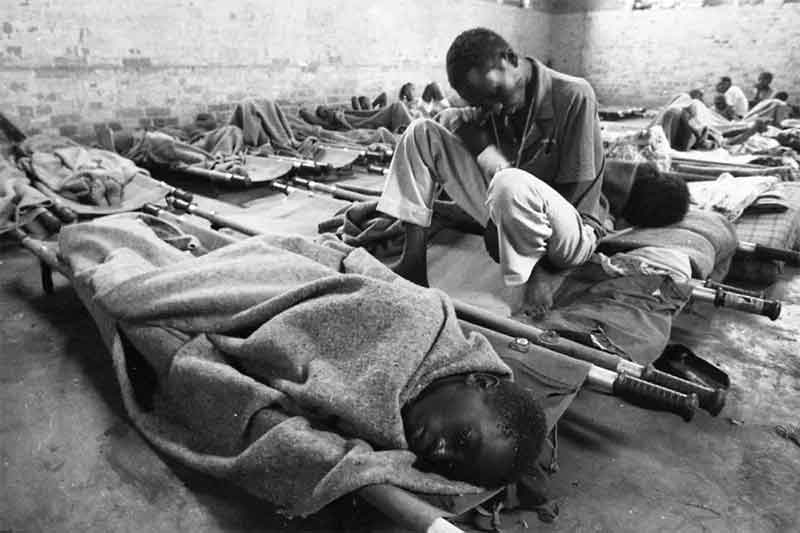
(e ). Population, sustainable carrying capacity, and Climate Genocide. Some leading climate scientists predict a human population in 2100 of only about 1 billion in the absence of requisite climate action. Indeed some demographers estimate a sustainable human population of only 1 billion by 2100. It has been estimated that for an American lifestyle we would need 7 planets and 3 planets for a European lifestyle. We are presently profligately operating on a 2 Planet Earth basis. Presently each year 9 million people die from air pollution from combustion of carbon fuels, about 20 million are displaced through climate change, about 7.6 million die avoidably from deprivation, and about 1 million die from climate change. In the absence of urgent requisite action it is estimated that 10 billion people will die this century in a worsening Climate Genocide en route to a sustainable human population in 2100 of only 1 billion [2].
(f ). Arctic methane bomb. The atmospheric methane (CH4) level is steadily increasing. CH4 has a Global Warning Potential (GWP) 105 times greater than that of the same mass of CO2 on a 20 year time frame basis and including aerosol impacts. CH4 is presently being released from the warming Arctic tundra and the Arctic Ocean sea bed. It has been estimated that 50 Gt of CH4 will be released in the Arctic in coming decades. This corresponds to 50 Gt CH4 / (1 t CH4 per 105 t CO2-equivalent ) = 5,250 Gt CO2-equivalent or 5.8 times greater than the Carbon Budget of 900 Gt CO2 for an 83% probability of avoiding a catastrophic +2C (Table 2 [1]).
(g). But for sulphate aerosols we would presently have a catastrophic +2C of warming. The present global warming is about +1.1C largely due to the burning of carbon fuels. However the consequence of burning fossil fuels is also generation of sulphur dioxide (SO2) that in turn generates global dimming sulphate aerosols in the upper atmosphere that restrict global warming to +1.1C from the +2C that it would be otherwise.
(h). Action now! The consensus Summary for Policymakers (SPM) is about “science” and steers clear of “politics”. But just as Biosphere-impacting solutions (e.g. preservation of what remains of wild nature) are “science” , so are Humanity-impacting solutions (e.g. constraints and taxes for sustainability) even though the neoliberal Mainstream would bellow that this is “politics”. Thus many scientists and science-informed activists argue that we need to return to the pre-Industrial Revolution level of about 300 ppm CO2 in the atmosphere for a safe and sustainable planet for all peoples and all species [2]. However the excellent organization 350.org argues for a politically more realistic target of no more than 350 ppm CO2. Science-trained Pope Francis demands that the social and economic cost of pollution should be “fully borne” by the polluters, as does eminent economist Lord Nicholas Stern (“climate change is the greatest market failure in history”). However the most radical policy actually seriously proposed by rich countries so far is the EU’s present plan for carbon pollution tariffs (Australia is among world leaders in 16 areas of climate criminality and has vociferously objected to this despite the carbon price-based reality that for every $1 billion of Australian exports there is a $0.5 billion carbon-related subsidy to be paid by future generations).
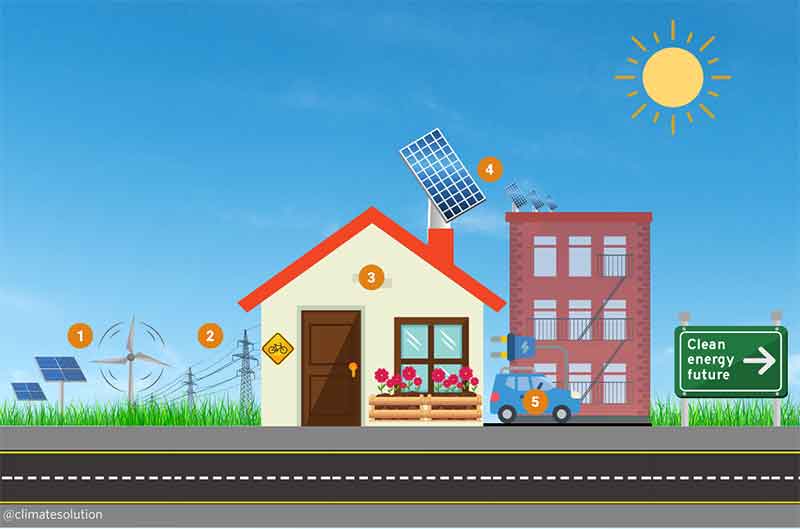
I conclude my huge book “Climate Crisis, Climate Genocide & Solutions” with an Epilogue that summarizes some 40 part solutions in 10 sections. A summary of this summary of solutions that should be addressed by the forthcoming 2021 Glasgow COP 26 UN Climate Change Conference is that there should be 100% renewable energy by 2030; zero new carbon fuel exploitation; cessation of carbon fuel burning ASAP; zero net emissions ASAP; a rapid return to 300 ppm CO2; population control; cessation of the present horrific Biodiversity loss; and rigorous punishment of individual, corporate and national climate criminals, variously through Boycotts, Divestment and Sanctions (BDS), carbon tariffs, ICC prosecutions, ICJ litigations, and judicially-imposed financial and custodial punishments. Urgent implementation of this crucial, Planet-saving agenda would be greatly facilitated by a one-person-one-vote World Government with gender equity, a voice for children, and a prime responsibility for the Biosphere, just economics and sustainability.
References.
[1]. Intergovernmental Panel on Climate Change (IPCC), “Climate Change 2021. The physical science basis. Summary for Policymakers”, 7 August 2021: https://www.ipcc.ch/report/ar6/wg1/downloads/report/IPCC_AR6_WGI_SPM.pdf .
[2]. Gideon Polya, “Climate Crisis, Climate Genocide & Solutions”, Korsgaard Publishing, Germany 2021.
[3]. Gideon Polya, “Climate Criminal Australia & US Ignore Climate Crisis, Climate Genocide & Solutions”, Climate Genocide, 7 February 2021: https://sites.google.com/site/climategenocide/2021-02-07-gideon-polya-climate-criminal .
[4]. Stephen Hawking, “Brief Answers to the Big Questions”, 2018, John Murray, 2018, Chapter 7.
[5]. Robert Goodland and Jeff Anfang. “Livestock and climate change. What if the key actors in climate change are … cows, pigs and chickens?”, World Watch, November/December 2009: http://www.worldwatch.org/files/pdf/Livestock%20and%20Climate%20Change.pdf .
[6]. Gideon Polya, “Extrapolating 11,000 scientists’ climate emergency warning to 2030 catastrophe”, Countercurrents, 14 November 2012: https://countercurrents.org/2019/11/extrapolating-11000-scientists-climate-emergency-warning-to-2030-catastrophe/ .
[7]. Gideon Polya, “Biochemical Targets of Plant Bioactive Compounds”, Taylor and Francis, CRC Press, London and New York, 2003.
Dr Gideon Polya taught science students at La Trobe University, Melbourne, Australia over 4 decades. He published some 130 works in a 5 decade scientific career, notably a huge pharmacological reference text “Biochemical Targets of Plant Bioactive Compounds”. He has also published “Body Count. Global avoidable mortality since 1950” and “Jane Austen and the Black Hole of British History”. He has recently published “US-imposed Post-9-11 Muslim Holocaust & Muslim Genocide” (2020) and “Climate Crisis, Climate Genocide & Solutions” (2021). For images of Gideon Polya’s huge paintings for the Planet, Peace, Mother and Child see: http://sites.google.com/site/artforpeaceplanetmotherchild/ .