The following statement is issued by the South Asian People’s Action on Climate Change (SAPACC), a rainbow coalition of individuals and organizations from Bangladesh, India, Nepal and Sri Lanka who are deeply concerned about the climate crisis.
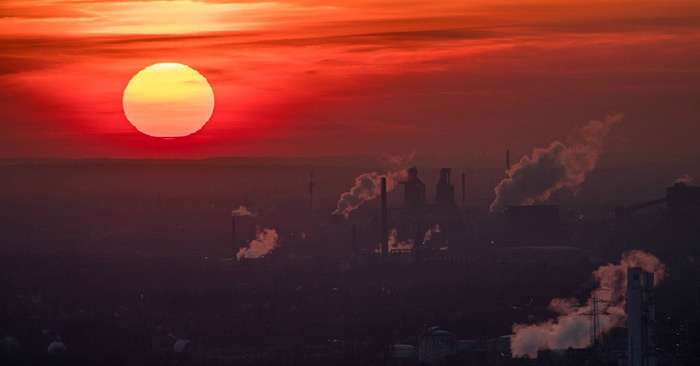
Greenhouse gases (GHGs) have caused an observed average global warming of 1.1oC above pre-industrial temperatures. That global warming is due to anthropogenic carbon emissions, which grew exponentially after industrial capitalism struck deep roots in the 19th Century, has been known since 1896 when Svante Arrhenius published his computations on this subject. Since the early 20th Century scientists, to name a few–Callendar, Plass, Keeling, Lorenz, Emiliani, Manabe, Broecker, and Hansen, have warned the world of the grave dangers carbon emissions pose to the planet because they will the earth’s disturbed energy balance, weaken the thermohaline circulation, collapse Antarctic’s ice sheets, bleach of coral reefs, trigger extreme weather events and increase cyclonic storm frequencies and intensities. Thaw the permafrost, and consequently impact human society adversely.
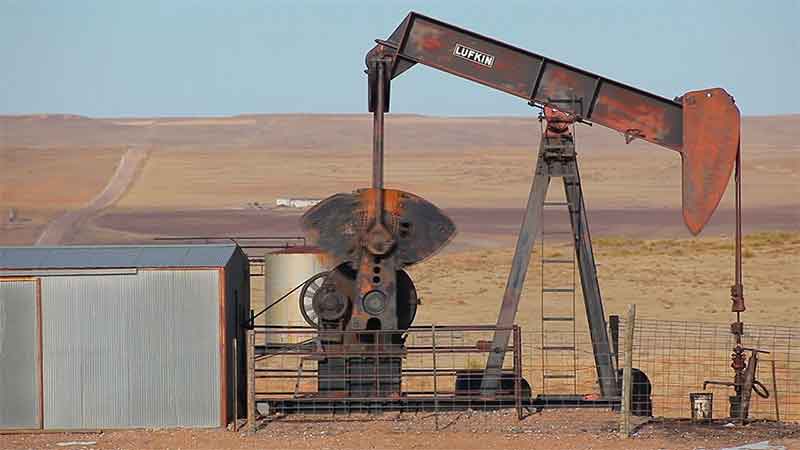
The hydrocarbon industry, e.g., Exxon, BP, Chevron, and many governments of large carbon-emitting countries were aware of the risks of climate change for over half a century. Yet fossil fuel burning continued unabated till today to up the atmospheric carbon dioxide (CO2) concentrations to ~420 ppm, which is 50% greater than pre-industrial times. To protect their business interests, a section of the hydro-carbon industry even funded global warming deniers.
Failure of the climate agreements
The Kyoto Protocol aimed to reduce developed countries’ (Annex 1 countries) emissions by 5.2% by 2012 over the base year 1990. Instead, during this period, the consumptive emissions of these countries increased by 14.5%. The primary emissions reduction instruments—the clean development mechanism (CDM) and joint implementation (JI) failed to deliver. Between 2008 and 2021, CDM projects theoretically prevented or removed emissions amounting to 2.16 GtCO2, constituting just 1.25% and 0.5% of the cumulative emissions of the Annex 1 countries and global emissions, respectively. Up to September 2021, JI had effected an emission reduction of 872 MtCO2, i.e., 0.5% of the cumulative emissions of the Annex 1 countries. Even if we presume that the CDM and JI worked well, they prevented or removed less than 2% of the cumulative emissions of Annex 1 countries, a fraction that is too small to make a difference.
There were other reasons for the CDM’s failure. The CDM did not deliver real, measurable, and more importantly, additional emissions reduction, i.e., emission reductions that happen solely due to the CDM. Studies done by the Oko Institute, Grantham Institute and Compensate show that a large number of projects were granted CDM status even though they would have effected emissions reduction without this status. In many projects, the declared emissions reduction was inflated, and some projects caused human rights violations. The inclusion of ‘sink’ projects, e.g., forestry, in the CDM undermined the effort to reduce emissions by the Annex 1 countries. Since certified emission reduction credits (CERs) under the CDM are market-tradable instruments, their demand and price fluctuated with economic swings. The 2008 economic slowdown reduced Europe’s emissions and consequently the demand for CERs.
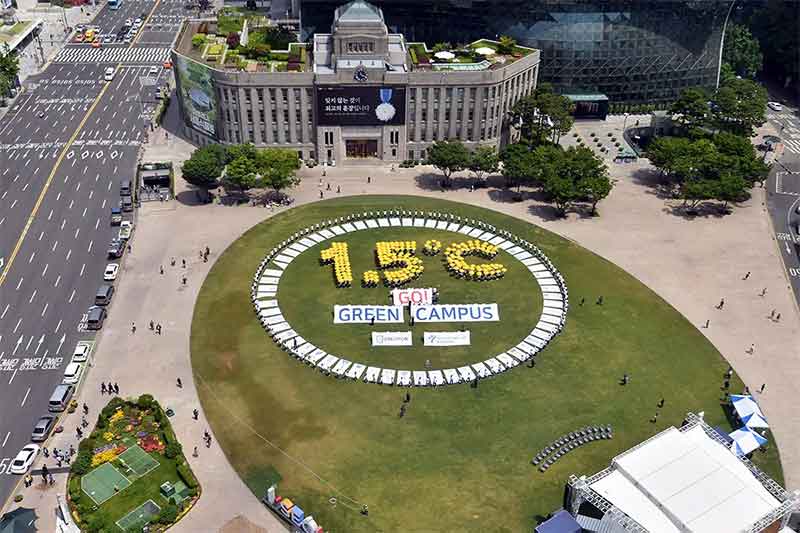
The Paris Agreement has not worked, at least till now. In their latest report, Climate Change 2021: The Physical Science Basis, released in August 2021, the Intergovernmental Panel on Climate Change, warns that to meet the ≤1.50C warming ambition, current emissions must be halved by 2030-35, and the world should become net carbon zero by 2050-55. That implies that emissions must be reduced by >7% per annum (pa) for the next 30 years. But global emissions have been growing by 1.2% pa since the 2015 Paris Agreement was signed.
Per the United Nations Environment Programme’s Emission Gap reports, the difference between projected emissions in 2030 considering national pledges to reduce emissions, and the desired ones to be ≤1.5oC compliant, known as the emissions gap, has increased by 33-35% between 2016 and 2022.
In the quarter century, since the Kyoto Protocol was signed, global energy consumption doubled to 14 Gtoe[1] in 2019, with fossil fuels and renewables contributing to 67% and 15% of the energy expansion, respectively, between 1997-2019 (see Table 1 in the Annex). renewable energy supplemented fossil fuels rather than replace them—a classic Jevon’s paradox. In the same period, the energy consumption of the Annex 1 countries remained constant at a little over 4 Gtoe, with just 0.3 Gtoe of fossil fuels being replaced by renewable energies—an unimpressive performance.
The low ambition of the largest GHG emitters, the odds at which climate science and policy are, and the failure of the market mechanisms have created an unenviable situation where we have 8 years left to halve our emissions. Instead of analysing the fundamental causes of climate change and its remedies, the 2021 Glasgow Conference of Parties (COP) 26 spent much time framing rules for the Paris Agreement’s market instruments that are akin to the failed ones under the Kyoto Protocol. The primary discourse in the COP meetings has ignored the fundamental role that anthropocentrism and privatization of nature have played in history in sanctifying and encouraging unbridled growth that is at the root of social inequality and unsustainability.
Our current emissions trajectory will cause an unbearable average global warming closer to 3oC by 2100 that will have catastrophic consequences for the environment and human society. India and the world are witnessing accelerated impacts-such as this year-at barely 0.8oC and 1.1oC average warming, respectively.
Winners and losers
With the head start that developed nations (Europe, USA, Canada, Australia and Japan) had for using fossil fuels since the industrial revolution began, the average per capita GDP of high-income countries in 2018 was US$ 44,787, ten-fold greater than that of low + middle-income countries (US$ 4,971) and twenty times that of South Asia (US$ 1,903).
There is a correlation between material development measured by per capita GDP, the Human Development Index (HDI) and per capita energy consumption and CO2 emissions (see Table 2 in the Annex). North countries have historically used more energy (per capita energy use today is 4.6 toe) and consequently have higher cumulative CO2 emissions. Developed countries with 16% of the global population today have consumed 69% of all fossil fuels expended since the industrial revolution and therefore are materially more advanced than developing countries. The latter constitute 84% of the world’s population today, but their per capita energy consumption is only 1.3 toe. The per capita cumulative emissions of North and South nations are 1,200 and 85 t/person[2], respectively (India’s per capita cumulative emissions are 35 t/person).
The world’s remaining available carbon space to be compliant with <1.5oC warming is <500 GtCO2. This space will shrink with the thawing of permafrost and further loss of the Amazon and boreal forests, leaving as little as 100 GtCO2 of carbon space to remain compliant with a warming of 1.5oC. At the current emission rate of ~40 GtCO2/year, the remaining carbon space will be erased in the next few years.
Developing countries are in a Catch22 situation. If they burn more fossil fuels to “develop,” they will contribute significantly to warming that will contribute to crossing the 1.5-2oC redlines. If they control their emissions to avoid crossing the temperature rise redlines, they will remain permanently backward in comparison to the developed countries. There is no visible alternative energy source replacement for fossil fuels that currently contribute 79% of the world’s commercial energy. Even if the entire remaining carbon space is given to developing countries, they cannot achieve the material standards of developed countries.
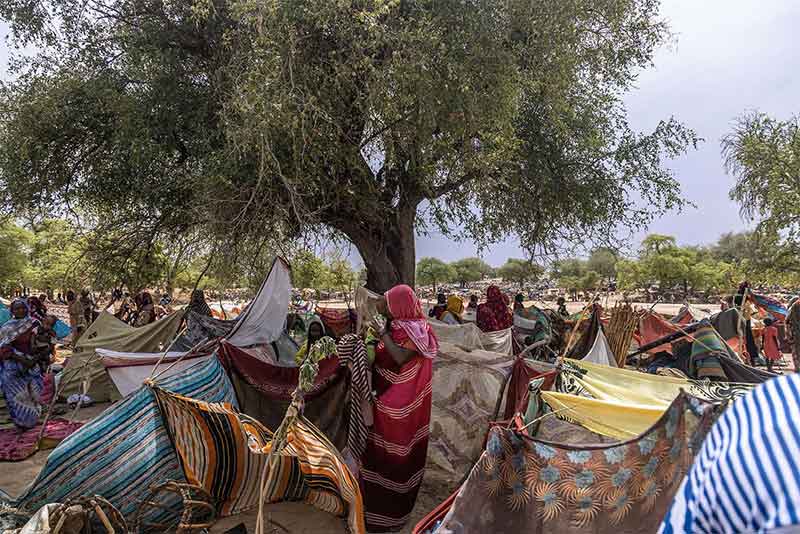
The extreme vulnerability of South Asia
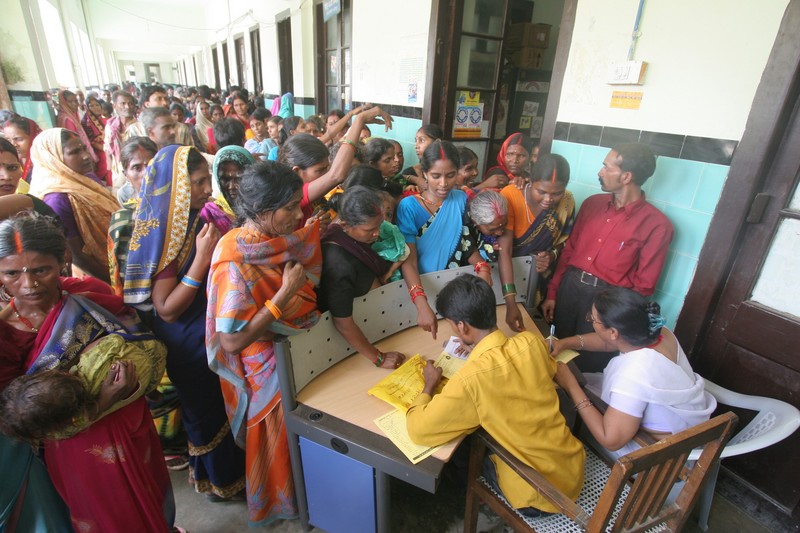
South Asia is one of two regions that already is, and will be most affected by climate change. It has a quarter of the world’s population but only 3.6% of its cumulative emissions. South Asia’s vulnerability is due to two factors–its geography and its low development. Its large land mass makes heat waves more severe, and its river deltas promote increased sea rise, decreased snow and glacier melt with warming will cause a decrease of water flow to snow-fed rivers and consequently cause water stress. South Asia’s current per capita GDP, which is less than a fifth of the global average, makes its population less resilient to meet climate change impacts. The primary risks to South Asia are outlined below:
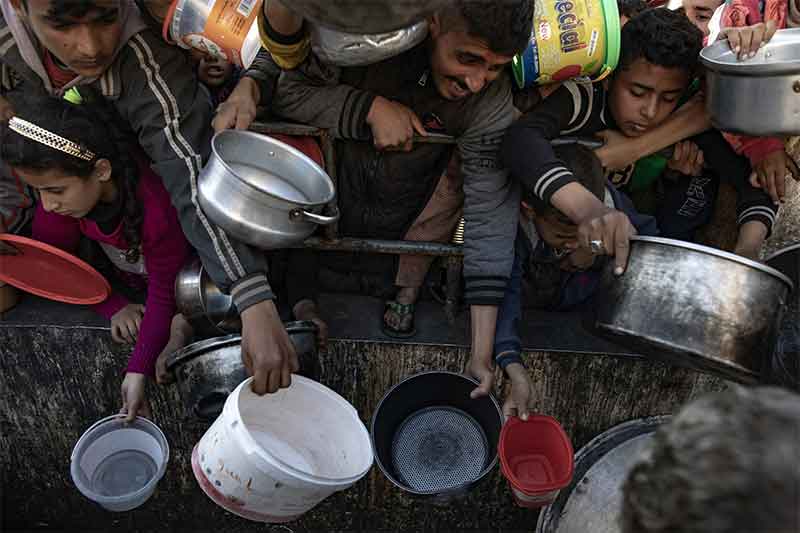
Sea level rise: Seawater intrusion will render inland water sources close to the Bangladesh coastline unusable for drinking and agriculture. With sea level rise, the mangroves of the Sundarbans forest will erode, and with it, the protection it offers against frequent storm surges during cyclones will diminish. By 2100, about 20-25% of Bangladesh’s land mass will be lost to the sea, creating 50 million Bangladeshi climate refugees by 2050 and probably double that number by the end of the 21st Century. Bangladeshi refugees will be forced to migrate to North Bangladesh and into neighbouring countries. Having lost their livelihood, they will be subject to all manner of indignity and abuse—unemployment, disease, and child trafficking.
By 2100, Maldives, an archipelago of ~1,200 low-lying islands and atolls in the Indian Ocean with a population of 500,000, will become all but uninhabited as sea rise will drown almost the entire island state. The entire population of Maldives will become climate refugees.
Water stress: Global warming is expected to significantly impact snow and glacier melt in the Himalayas. Water stress will impact all South Asian countries, except Bhutan. As the glaciers melt, they will initially cause an increase in meltwater in snow-fed drivers, followed by a decline. Glacial melt will impact all major snow-fed South Asian rivers—Brahmaputra (India, Bangladesh), Ganga (India, Bangladesh), Indus (India, Pakistan), Amu Darya (Afghanistan) and their tributaries.
Snow and glacier melt contribute a significantly higher amount to the total discharge (see Table 3 in Annex) in the Indus (60%) and the Amu Darya (70%) in comparison to the Ganga and the Brahmaputra (9-21%). The Indus basin is largely in Pakistan and a part of the Amu Darya basin is in Afghanistan. The Indus is the only major river that flows through Pakistan. In a warming world, the discharge of the Indus, and the Amu Darya will decrease significantly, causing large parts of Pakistan and northeastern Afghanistan to become severely water-stressed and drought-stricken by 2040-50, and that will compromise the water and food security of about 60 million people living in these basins. Though Sri Lanka does not have any major rivers, it will be water-stressed in a few decades.
Glacial lake outburst floods: As glaciers melt, the volume of water in a glacial lake located at the mouth of many Himalayan glaciers will increase and exert greater pressure on the moraine dam that holds it. When the water pressure on the dam exceeds its material failure limit, it will give way and the glacial lake will pour out millions of tonnes of water, causing a Glacial lake outburst flood (GLOF), whose impact will be felt for up to 100-150 km downstream. Villages, fields and everything else that is in a GLOF’s path will be washed away. A recent study compiled an inventory of 62 GLOFs that have occurred in the Himalayas in the last 80 years (see Table 4 in the Annex). With climate change, the frequency of GLOF is expected to increase in the Himalayas.
Extreme weather events: South Asia saw extremely hot March-April months, with temperatures soaring 4-5oC above normal. South Asia also had a very wet monsoon this year that killed 3,700 persons in floods that occurred in Afghanistan, Pakistan, India, Nepal, Bangladesh and Sri Lanka. A third of Pakistan was flooded in July-August, affecting 33 million persons, killing over 1,500 people, putting half a million people in relief camps and causing a property loss of $40 billion.
India will be impacted by many types of climate change-related events—sea rise, GLOFs, extreme weather events (abnormally high temperatures or precipitation), floods, drought, cyclones, significant crop yield losses, erratic rainfall, heat stress, etc. A large number of extreme weather events have occurred in India in the last 15 years (see Table 5 in the Annex), indicating that more of them are likely to happen in future.
A study on heat stress and mortality done in Surat concludes that “There is an increase of 11% all-cause mortality when temperature crossed 40oC. There is a direct relationship between mortality and HI (high heat index). Mean daily mortality shows a significant association with daily maximum temperature and HI.” Another recent study established a correlation between high temperatures and chronic kidney disease (CKD) in rural areas by reviewing studies done in several continents—Asia, North and South America and Africa. The study concludes, “One of the consequences of climate-related extreme heat exposure is dehydration and volume loss, leading to acute mortality from exacerbations of pre-existing chronic disease, as well as from outright heat exhaustion and heat stroke.”
SAPACC’s demands
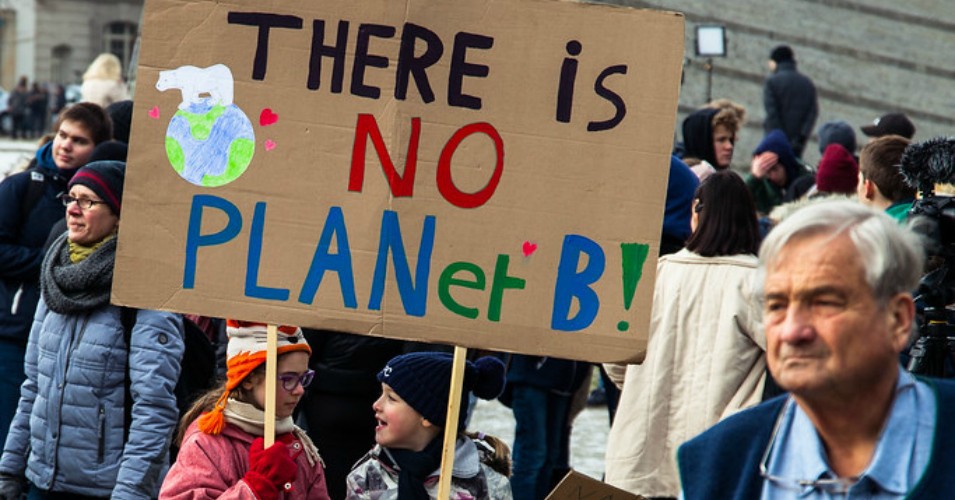
Considering the grave situation described above and the time for correction is very short, SAPACC calls upon the President of COP 27, the United Nations General Secretary, and all nations to declare a climate emergency immediately and consider implementing the following measures to move towards a sustainable, equitable and peaceful society:
- Sustainability: Developed nations must pledge to become net carbon negative in consumption emissions by 2030-35 to create space for developing nations to decarbonise by 2040-50. Decarbonisation must focus primarily on: a) Mitigation focussed on the reduction of consumption levels in the Global North, and supply-side management, leaving >90% of the remaining fossil fuel reserves in the ground; b) Sequestration focussed on Nature Based Solutions that centre climate and social justice. In addition, decarbonization strategies must eschew failed, untested, hypothetical market-based solutions and techno-fixes. Through these means, gross global consumption should be reduced to sustainable levels, the measure for which should be a quantifiable justice-centric sustainability index.
- Environmental justice: a) Responsibility for loss & damage: Nations/regions should take responsibility for climate change impacts attributable to them—displacement, property loss, etc—in proportion to their cumulative emissions (emissions from 1750-to date); Developed countries should deliver promised climate finance in time; b) Sharing benefits and risks equally: All people of the world should share equally the wealth created by GHG emissions as well as the risks caused by them. Humans have no property rights over fossil fuels as it is nature that made them.
- Equity: The maximum/minimum ratio for income/energy consumption for all people in the world should be ≤5.
- Environmental restitution: Degraded land, water, air, and to the extent possible, biodiversity should be restituted to their pre-industrial period quality.
- Decentralization, democratic, transparent climate governance: As people’s involvement is essential for tackling the climate crisis, climate governance should be decentralized and democratized, governance information should be in the public domain, and people’s assemblies set up worldwide to allow people’s voices to be heard and reflected in climate decisions.
Annex: Tables
Table 1: Global and Annex 1 country energy use by type since the Kyoto Protocol
| World | Annex 1 countries | |||||
| Total energy (Gtoe) | Fossil fuels (Gtoe) | Renewable energy (Gtoe) | Total energy (Gtoe) | Fossil fuels (Gtoe) | Renewable energy (Gtoe) | |
| 1997 | 7.9 | 7.74 | 0.67 | 5.12 | 4.29 | 0.34 |
| 2019 | 13.96 | 11.76 | 1.6 | 5.14 | 4.1 | 0.63 |
(Data available at https://ourworldindata.org/energy-mix)
Table 2: Correlation between material development and energy consumption and CO2 emissions

Table 3: Basin characteristics and snow/glacier melt contribution to downstream discharge
| Parameter | Ganga | Brahmaputra | Indus | Amu Darya |
| Snow and glacier melt contribution
to downstream discharge (%)[7] |
8.7 | 21 | 60 | 77 |
(Sources: https://doi.org/10.1659/MRD-JOURNAL-D-12-00027.1., https://www.the-cryosphere.net/9/1105/2015/tc-9-1105-2015.pdf., https://link.springer.com/article/10.1007/s10113-018-1429-0)
Table 4: Frequency of GLOF occurrence in the last century
| Period | Central Himalayas | Eastern Himalayas | Per cent occurrence |
| Nos | Nos | % | |
| 1930-39 | 1 | 3 | |
| 1940-1959 | 0 | 5 | 13 |
| 1960-79 | 7 | 2 | 23 |
| 1980-1999 | 9 | 4 | 33 |
| 2000-2019 | 8 | 3 | 28 |
| Total | 25 | 14 | 100 |
Table 5: Extreme weather events in India in the 21st Century
| Year | Event | Location | Estimated deaths |
| 2005 | Very heavy rainfall | Mumbai | 1,100 |
| 2013 | Cloudburst | Kedarnath | >5,000 |
| 2015 | Very heavy rainfall | Chennai | 500 |
| 2018 | Heatwave | All over India | 2,405 |
| 2018 | Very heavy rainfall | Kerala | 500 |
| 2019 | Very high temperatures | Maharashtra, Madhya Pradesh | 50 |
| 2019 | Heavy rainfall & floods | Maharashtra, Karnataka, Goa, Kerala | ~300 |
| 2022 | Heavy rainfall & floods | Karnataka, Himachal Pradesh, Uttarakhand, Gujarat, Maharashtra, Assam, Telangana | 992 |
| 2022 | Heatwave | All over India |
[1] 1 toe-tonne of oil equivalent, i.e., the energy contained in 1 t of oil = 42 Giga Joules. G = Giga. 1 Gtoe = 4.2 x 10¹⁸ Joules
[2] Per capita cumulative emissions are computed by dividing the cumulative emissions (1751-2017) of a country/region divided by the current population.
[3] Current and cumulative CO2 emissions are territorial emissions.
[4] Per World Bank classification.
[5] Central Asia consists of Kazakhstan, Kyrgyzstan, Tajikistan, Turkmenistan, and Uzbekistan. Their country statistics are clubbed with that of Europe as they are former Soviet republics and were earlier reported as part of Soviet Union. Since their combined population in 2018 was 72.5 million, i.e., 0.95% of global population, and their per capita energy consumption and CO2 emissions are relatively low, combining their statistics with Europe will not alter the understanding of Europe significantly.
[6] Data for Europe and Europe+Central Asia for 2017.
[7] It is important to note that the discharge figures for Amu Darya is for elevations >2,000 m, whereas the figures for Ganga, Brahmaputra and Indus are for total discharges. While the contribution of snow and glacier melt as a fraction of discharge that is quoted in this paper is probably higher than for the total discharge of this river, as much of the Amu Darya drainage is in the Pamir mountains whose elevations are >1,000-2,000 m. The figure quoted in this paper provides the reader with an approximate idea of the probable percentage contribution of snow and glacier melt to this river.