


Whither Shale Oil?
By Steve Andrews
14 August, 2013
ASPO-USA
Interview with David Hughes
Q: Andrews--Production from shale oil plays has been impressive and has taken the national energydialogue by storm. When did you sense that the shale oil plays had the kind of muscle they are currently showing?
A: Hughes—The Bakken certainly came on the radar five years ago, not only in the US but also in Canada. So it certainly caught my attention, but it wasn’t until I started working on my Drill-Baby-Drill report in 2012 that I really got into the data enough to truly understand what was going on with the Bakken. It certainly was phenomenal. I looked at production through May of 2012 for that report, and at that point it was already over half-a-million barrels per day. The Eagle Ford was not anywhere close to that, though the Eagle Ford has caught up and could even be ahead of the Bakken now.
So there is definitely muscle there. The big question is, how sustainable is that in the long term?
Q: You’re known for following the numbers closely. Based on your analysis, how does your view of the next five years of shale oil production compare with that of a couple of the high-profile perspectives: the EIA’s and CitiGroup’s January 2012 forecast?
A: It’s interesting that the EIA has changed their outlook. For example, if you look at the April 2012 Annual Energy Outlook, they projected close to 12,000 locations available to drill in the Bakken and Three Forks formations. In their April 2013 Outlook, they’ve projected 43,000 drilling locations, so they’ve almost quadrupled their estimate of the number. And in the Eagle Ford they’ve doubled their estimate of drilling locations to 22,000. As a result, they’ve doubled their estimate of recoverable oil. However, if you look at the 2013 EIA forecast for tight oil, they’re actually pretty conservative compared to CitiGroup. The 2013 EIA reference case forecast projects a second peak in US oil production in about 2019, reflecting a 2020 peak and decline of tight oil.
In last year’s Outlook, the EIA had an estimated EUR [Estimated Ultimate Recoverable] figure for the average Bakken oil well of 550,000 barrels of oil. Since then they’ve actually lowered that quite a bit, to an average of 93,000, 211,000 and 372,000 barrels for Montana, non-core North Dakota and core North Dakota areas, respectively, while radically increasing their estimate of drillable locations. So the EIA is a voice of conservatism compared to CitiGroup. Ed Morse’s January 2012 CitiGroup report suggested that the Bakken and Eagle Ford would each rise to more than one million barrels per day and would plateau there until at least 2022 and presumably beyond that.
But when you look at any projections they critically depend on how many drillable locations you have. I looked at EIA’s estimates for the Bakken and compared them to maps of well productivity and distribution(figures 1 and 2), and I would say they have over-estimated the number of remaining drillable locations by about 60%. So if the EIA’s well density for the Bakken—two wells per section—is correct, there may be 26,000 locations total. There have been about 6,000 wells drilled to date, so that leaves about 20,000 left to be drilled.
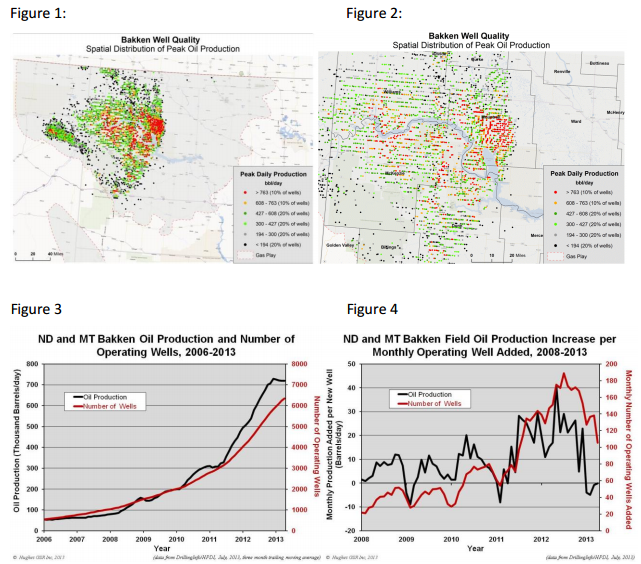
Figures – 1) Distribution of wells colored by highest one month production showing the EIA outline of the Bakken/Three Forks play area in light gray; 2) Close up of sweet spot in Sanish-Parshall area in the east-central portion of the field; 3) Well count and production for the Bakken/Three Forks in Montana and North Dakota through April 2012 (from Drillinginfo database with a 3 month trailing moving average); 4) Bakken monthly field production change per new well and the well count added per month illustrating that a drilling rate of 120 wells per month is required to hold production flat at the April production level of 725,000 b/d.
My estimate last year showed a peak in the Bakken in 2017 at nearly one million b/d, if you drilled 2,000 wells per year. But that was based on the EIA’s 2012 estimate of just under 12,000 well locations. Given the new EIA estimates of well locations I think the Bakken could reach the 2020 time range before declining. The Bakken is currently producing about 725,000 barrels per day from a little over 6000 wells (Figure 3). Right now the Bakken needs about 1440 wells per year just to offset field production decline (Figure 4). When the Bakken is going to peak depends on the number of well locations that are left and how fast you drill the wells.
As you grow production, the number of wells you need simply to offset decline keeps on increasing.
In every shale play I’ve looked at there are always sweet spots. Those inevitably get drilled first. So as the sweet spots are drilled off, drilling has to move into lower quality parts of the reservoir. Therefore you need an ever-escalating number of wells drilled just to offset field decline. So if the Bakken were to hit a million barrels/day of production, which it probably will, it will then likely need about 2000 wells drilled per year just to offset decline.
So play that out: there are 20,000 locations remaining—optimistically. So we’re basically looking at 10 yearsor less for the Bakken—certainly not the rosy forecast, in terms of longevity, that comes out of places like CitiGroup.
Q: By 10 years for the Bakken, you mean 10 years of high levels of production? Or medium levels?
A: Ten years at levels above say half a million barrels per day. A near term rise to peak followed by decline. As you move into lower quality rock, production per well declines and so do the economics, as the cost of wells remains constant. So that will tend to constrain drilling. This also means that rising numbers of lower productivity wells will be required to offset field decline. So if those 20,000 locations exist, the peak of production in the Bakken could be around 2020, possibly sooner, followed by a decline. So the Bakken will continue to produce oil for decades, but at a much lower rate.
Q: So the production curve for the Bakken might look like a steep ascent followed by a bit of a production plateau—maintained through a struggle—followed by what: a cliff?
A: Yes, as soon as you run out of locations, then it’s a cliff, declining at 44% per year for the Bakken.
Q: What do you see for the Eagle Ford in terms of peak production and timing?
A: Last year I used the EIA’s 2012 estimated number of drillable locations—just under 12,000. Depending on how fast you drill wells, I projected a peak somewhere between 2015 and 2017, assuming 2000 and 2500 wells per year, respectively. They’re now drilling 3000 wells per year. Close to 10% of all wells drilled in the US are being drilled in the Eagle Ford. However, in its 2013 analysis the EIA increased its estimate of drillable locations to 22,000. They’re counting on 5.4 wells being drilled per section, in terms of that number of locations. I haven’t done the same spatial analysis as I did on the Bakken to examine the credibility of that EIA assessment for the Eagle Ford. Assuming they’re right, 22,000 locations would push the peak for the Eagle Ford out to around 2020.
But there’s quite of range of well qualities in the Eagle Ford. Some of them are really great, coming on at 700 barrels per day or greater. But with the variability, the same pattern will happen. The sweet spots will be saturated, then drilling will have to move to lower quality rock and the economics will degrade. But for now the economics of the Eagle Ford are very good, which is why there is so much drilling going on there.
Q: Why do you think there is such a big difference between your analysis and CitiGroup’s?
A: I’ve read the report and looked at their projections. I just wonder what kind of data they’ve actually looked at in order to come up with those projections. What I’ve used is basically all of the well production data, so I can calculate for any sub-area of any play the average well decline per year over time.
I’ve developed what I call the life-cycle of a shale play, based on both shale gas and tight oil. They’re very similar; typically they have very high well decline rates and high field decline rates in contrast to conventional oil fields. Early on in a shale play the average IPs [initial productivity] of wells rise quite dramatically, through the process of discovery of the sweet spots and concentrating drilling there, as well as applying better technology (longer horizontal laterals and more fracking stages). Eventually you hit a peak in the IP rate, which was hit in the Bakken in 2010. Since then, IPs in the Bakken have been flat. Since the Eagle Ford is a newer play than the Bakken, its IPs are increasing and there are still a lot of locations to drill in the sweet spots. Inevitably IPs will peak and fall, like every other mature shale play I’ve looked at.
If you look at the Haynesville shale gas play in Louisiana, the IPs peaked in 2010 and are now down about 20% below peak so they are running out of good quality ground. The well costs are staying the same but the well Peak Oil Review Association for the productivity is declining no matter how much new technology they apply. In those mature shale plays, geology trumps technology every time.
Q: What’s your view of the prospects for California’s Monterey shale oil play?
A: The Monterey is hyped as being the number one shale play in terms of technically recoverable resources, according to the EIA. So far it really doesn’t stack up to either the Eagle Ford or the Bakken, if you look at well productivity. It’s a difficult play, very complex stratigraphically and broken up by a lot of faulting. And it really hasn’t generated the stellar production that would justify the hype, from what I’ve seen so far. I’m deeply in the weeds on a study of the Monterey. There’s a report prepared by the University of California which really hyped the Monterey as being a kind of solution for California’s debt problems. I’m still scratching my head about that one. They seem to be incredibly optimistic. The EIA is suggesting 13.7 billion barrels of recoverable oil from the Monterey and they’re suggesting 16 wells per section. That’s nearly 28000 wells, with each well producing a half-million barrels of oil. So far we haven’t seen anything like that. So the jury is definitely still out on the Monterey, from where I sit. I’ll come out with a more detailed analysis over the next few weeks.
Q: When you add it all up, what’s the range you see for US production at a secondary peak from shale oil, and what’s the range as to when you anticipate that occurring?
A: If you believe the new estimates from the EIA in terms of available drilling locations in the Bakken and Eagle Ford—which I’ve discounted somewhat—I would see a tight-oil peak in the 2020 to 2022 time range. If you look at the background declines of other traditional sources of oil, the EIA could be fairly close with their 2019 estimate for a secondary peak of all US oil, though I wouldn’t be surprised if it’s sooner than that. I consider their estimates of well locations fairly optimistic. And their assumption that the EURs from those wells will remain constant going forward is unlikely to happen given that the best parts of plays are drilled first.
Q: What are some of the major factors that could impact your scenario both to the upside and downside?
A: Again it boils down to the number of locations and their quality. When you look at the density of drilling in the sweet spots in the Bakken, considering that wells typically have 10,000 foot laterals, there are about four laterals per section, with the laterals spaced about 1400 feet apart (at the EIA’s estimated density of two wells per section). Presumably, they could drain about a 700 foot radius around the well. Is there interference when you drill with that density? If there is, then that number of wells doesn’t really get you more oil and it damages the economics. That would be the downside—an over-estimate in terms of the number of wells that you can actually put in a given area.
The upside is that I’ve underestimated the area that has potential in the Bakken/ThreeForks. I’ve said the EIA has overestimated the available drillable area by about 60%. If I’m wrong, there will be more locations.
If the Monterey actually comes through at scale, that would make a difference. It is 13.7 of 47 billion barrels in the EIA’s latest estimate for technically recoverable tight oil.
Q: What about the world level? Are you getting a sense that there will be any significant shale oil produced in a timely fashion elsewhere around the world?
A: Yes, there will be shale oil developed outside the US; there already is some in Canada. But the oil and gas culture here in North America is vastly different than what exists elsewhere in the world. So I think development of tight oil elsewhere is going to be much slower than it is in the US. We should look at tight oil as a brief reprieve in terms of the overall world supply picture. Conventional medium and light oil has basically been on a plateau since 2005. It has gone up a little bit, but the growth in liquids supply has really come from tar sands, heavy oil, tight oil, natural gas liquids and biofuels—in other words from expensive, difficult-to-develop sources. In my view the tight oil reprieve is not sustainable at high levels. But it is buying us a bit of time. I certainly don’t think people should be complacent about the oil supply picture going forward because of North American tight oil production.
Q: That is obviously a discordant message with the standard line from that which we hear from the press of late. How do the press and the industry respond to your message?
A: It spans a spectrum. If you talk to scientists and geologists, they are generally my biggest supporters. I havelunch with the manager of gas supply for a large multi-national whenever I am in Calgary. But he certainly can’t reiterate anything that we talked about when he goes back to work. Old (retired) colleagues at the Geological Survey of Canada are huge fans. People who actually work for the Canadian government are more reticent to share that view, although some of them do privately. People who have taken swipes at me, including a fellow from Forbes magazine, often appear to me to be industry shills, not scientists. A lot of what you hear in the press is people just filling column-inches, surveying opinions, repeating the new conventional wisdom. Not many of them have actually gone to the numbers and ground the data—that’s relatively rare.
And a lot of the industry players have a vested interest in a certain point of view. I’m in the very enviable position of being retired with a federal government pension check. I don’t have any vested interest except for my four grandkids and my concern for what their future will be like. We really do have to rethink the whole paradigm of the human race’s high reliance on fossil fuel energy that has served us so well over the last century.
Post Carbon Fellow David Hughes is a geologist who served with the Geological Survey of Canada for more than three decades. He now heads the consultancy Global Sustainability Research Inc.
Comments are moderated