

Happy 35th Birthday, Global Warming!
By Real Climate
01 August, 2010
Real Climate
Global warming is turning 35! Not only has the current spate of global warming been going on for about 35 years now, but also the term “global warming” will have its 35th anniversary next week. On 8 August 1975, Wally Broecker published his paper “Are we on the brink of a pronounced global warming?” in the journal Science. That appears to be the first use of the term “global warming” in the scientific literature (at least it’s the first of over 10,000 papers for this search term according to the ISI database of journal articles).
In this paper, Broecker correctly predicted “that the present cooling trend will, within a decade or so, give way to a pronounced warming induced by carbon dioxide”, and that “by early in the next century [carbon dioxide] will have driven the mean planetary temperature beyond the limits experienced during the last 1000 years”. He predicted an overall 20th Century global warming of 0.8ºC due to CO2 and worried about the consequences for agriculture and sea level.
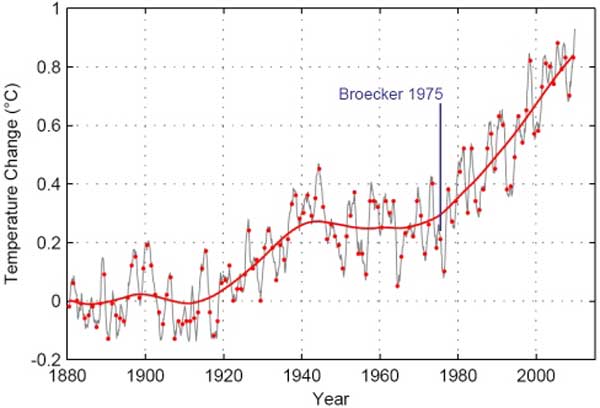
Global temperature up to June 2010 according to the NASA GISS data. Grey line is the 12-month running average, red dots are annual-mean values. The thick red line is a non-linear trend line. Broecker of course did not have these data available, not even up to 1975, since this global compilation was only put together in the late 1970s (Hansen et al. 1981). He had to rely on more limited meteorological data.
To those who even today claim that global warming is not predictable, the anniversary of Broecker’s paper is a reminder that global warming was actually predicted before it became evident in the global temperature records over a decade later (when Jim Hansen in 1988 famously stated that “global warming is here”).
Broecker is one of the great climatologists of the 20th Century: few would match his record of 400 scientific papers, a full sixty of which have over 100 citations each! Interestingly, his “global warming” paper is not amongst those highly-cited ones, with “only” 79 citations to date. Broecker is most famous for his extensive work on paleoclimate and ocean geochemistry.
It is very instructive to see how Broecker arrived at his predictions back in 1975 – not least because even today, many lay people incorrectly assume that we attribute global warming to CO2 basically because temperature and CO2 levels have both gone up and thus correlate. Broecker came to his prediction at a time when CO2 had been going up but temperatures had been going down for decades – but Broecker (like most other climate scientists at the time, and today) understood the basic physics of the issue.
Basically his prediction involved just three simple steps that in essence are still used today.
Step 1: Predict future emissions
Broecker simply assumed a growth in fossil fuel CO2 emissions of 3% per year from 1975 onwards. With that, he arrived at cumulative fossil CO2 emissions of 1.67 trillion tons by the year 2010 (see his Table 1). Not bad: the actual emissions turned out to be about 1.3 trillion tons (Canadell et al, PNAS 2007 – estimate extended to 2010 by me).
A shortcoming, from the modern point of view, is that Broecker did not include other anthropogenic greenhouse gases or aerosol particles in his calculations. He does however discuss aerosols, which he calls “dust”. In fact, the first sentence of the abstract (quoted above) in full starts with an if-statement:
If man-made dust is unimportant as a major cause of climate change, then a strong case can be made that the present cooling trend will, within a decade or so, give way to a pronounced warming induced by carbon dioxide.
That is a nod to the discussion about aerosol-induced cooling in the early 1970s. Broecker rightly writes:
It is difficult to determine the significance of the next most important climatic effect induced by man, “dust”, because of uncertainties with regard to the amount, the optical properties and the distribution of man-made particles,
citing a number of papers by Steve Schneider and others. Because he cannot quantify it, he leaves out this effect. Here luck was on Broecker’s side: the warming by other greenhouse gases and the cooling by aerosols largely cancel today, so considering only CO2 leads to almost the same radiative forcing as considering all anthropogenic effects on climate (see IPCC AR4, Fig. SPM.2).
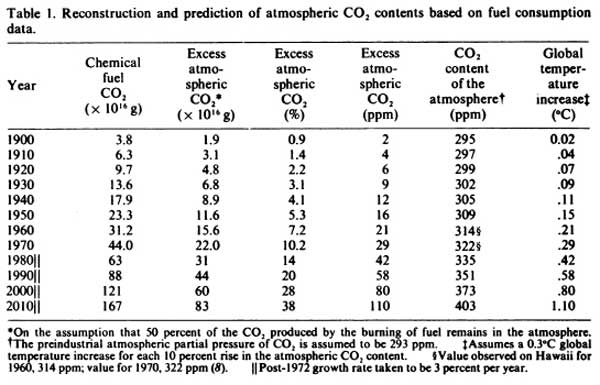
Table 1 of Broecker (1975)
Step 2: Predict future concentrations
To go from the amount of CO2 emitted to the actual increase in the atmosphere, one needs to know what fraction of the emissions remains in the air: the “airborne fraction”. Broecker simply assumed, based on past data of emissions and CO2 concentrations (Keeling’s Mauna Loa curve), that the airborne fraction is a constant 50%. I.e., about half of our fossil fuel emissions accumulates in the atmosphere. That is still a good assumption today, if you look at the observed CO2 increase as fraction of fossil fuel emissions. Broecker calculated that about 35% of the emissions is taken up by the ocean and the other 15% by the biosphere (again not far from modern values, see Canadell et al.). On this basis he argued that if the ocean is the main sink, the airborne fraction would remain almost constant for the decades to come (his calculations extend to the year 2010).
Thus, with a 3% increase in emissions per year and 50% of that remaining airborne, it is easy to compute the increase in CO2 concentrations. He obtains an increase from 295 to 403 ppm from 1900 to 2010. The actual value in 2010 is 390 ppm, a little lower than Broecker estimated because his forecast cumulative emissions were a little too high.
Step 3: Compute the global temperature response
Now we come to the temperature response to increased CO2 concentration. Broecker writes:
The response of the global temperature to the atmospheric CO2 content is not linear. As the CO2 content of the atmosphere rises, the absorption of infrared radiation will “saturate” over an ever greater portion of the band. Rasool and Schneider point out that the temperature increases as the logarithm of the atmospheric CO2 concentration.
Based on this logarithmic relationship (still valid today) Broecker assumes a climate sensitivity of 0.3ºC warming for each 10% increase in CO2 concentration, which amounts to 2.2ºC warming for CO2 doubling. This is based on early calculations by Manabe and Wetherald. Broecker writes:
Although surprises may yet be in store for us when larger computers and better knowledge of cloud physics allow the next stage of modeling to be accomplished, the magnitude of the CO2 effect has probably been pinned down to within a factor of 2 to 4.
The AR4 gives the uncertainty range of climate sensitivity as 2-4.5ºC warming for CO2 doubling, so there still is about a factor of 2 uncertainty and Broecker used a value near the very low end of this uncertainty range. Modern estimates are not only based on model calculations but also on paleoclimatic and modern data; the AR4 lists 13 studies that constrain climate sensitivity in its table 9.3.
In Broecker’s paper the warming calculated with the help of climate sensitivity happens instantaneously. Today we know that the climate system responds with a time lag due to ocean thermal inertia. By neglecting this, Broecker overestimated the warming at any given time; accounting for thermal inertia would have reduced his warming estimate by about a third (see AR4 Fig. SPM.5). But again he was lucky: picking ~2ºC rather than the more likely ~3ºC climate sensitivity compensates roughly for this, so his 20th-Century warming of 0.8ºC is almost spot on (the actual estimate being closer to 0.7ºC, see Fig. above). (A modern version of this back-of-envelope warming calculation is found e.g. in our book Our Threatened Oceans, p.82.)
Natural Variability
Broecker was not the first to predict CO2-induced warming. In 1965, an expert report to US President Lyndon B. Johnson had warned: “By the year 2000, the increase in carbon dioxide will be close to 25%. This may be sufficient to produce measurable and perhaps marked changes in climate.” And in 1972, a more specific prediction similar to Broecker’s was published by the eminent atmospheric scientist J.S. Sawyer in Nature (for a history in a nutshell, see my newspaper column here).
The innovation of Broecker’s article – apart from introducing the term “global warming” – was in combining estimates of CO2 warming with natural variability. His main thesis was that a natural climatic cooling
has, over the last three decades, more than compensated for the warming effect produced by the CO2 [....] The present natural cooling will, however, bottom out during the next decade or so. Once this happens, the CO2 effect will tend to become a significant factor and by the first decade of the next century we may experience global temperatures warmer than any in the last 1000 years.
The latter turned out to be correct. The idea that the small cooling from the 1940s to 1970s is due to natural variability still cannot be ruled out, although more likely this is a smaller part of the explanation and the cooling is primarily due to the “dust” neglected by Broecker, i.e. due to the rise of anthropogenic aerosol pollution (Taylor and Penner, 1994). However, the way Broecker estimated and even predicted natural variability has not stood the test of time. He used data from the Camp Century ice core in Greenland, arguing that these “may give a picture of the natural fluctuations in global temperature over the last 1000 years”. Ironically, Broecker’s own later work on Atlantic ocean circulation changes showed that Greenland is likely even less representative of global temperature changes than most other places on Earth, it being strongly affected by variability in ocean heat transport (see our recent post on the Younger Dryas, or Broecker’s latest book The Great Ocean Conveyor). However, Broecker was right to conclude that the buildup of CO2 would sooner or later overwhelm such natural climate variations.
Overall, Broecker’s paper (together with that of Sawyer) shows that valid predictions of global warming were published in the 1970s in the top journals Science and Nature, and warming has been proceeding almost exactly as predicted for at least 35 years now. Some important aspects were not understood back then, like the role of greenhouse gases other than CO2, of aerosol particles and of ocean heat storage. That the predictions were almost spot-on involved an element of luck, since the neglected processes do not all affect the result in the same direction but partly cancel. Nevertheless, the basic fact that rising CO2 would cause a “pronounced global warming”, as Broecker put it, was well understood in the 1970s. In a 1979 TV interview, Steve Schneider rightly described this as a consensus amongst experts, with controversy remaining about the exact magnitude and effects.
Reference
BROECKER WS, 1975: CLIMATIC CHANGE – ARE WE ON BRINK OF A PRONOUNCED GLOBAL WARMING?
SCIENCE Volume 189, Pages 460-463.