BP recently published energy data through December 31, 2017, in its Statistical Review of World Energy 2018. The following are a few points we observe, looking at the data:
[1] The world is making limited progress toward moving away from fossil fuels.
The two bands that top fossil fuels that are relatively easy to see are nuclear electric power and hydroelectricity. Solar, wind, and “geothermal, biomass, and other” are small quantities at the top that are hard to distinguish.
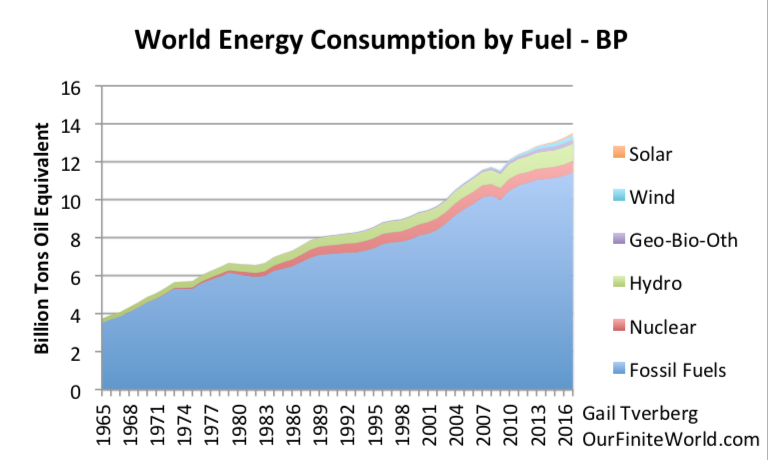
Figure 1. World energy consumption divided between fossil fuels and non-fossil fuel energy sources, based on data from BP 2018 Statistical Review of World Energy 2018.
Wind provided 1.9% of total energy supplies in 2017; solar provided 0.7% of total energy supplies. Fossil fuels provided 85% of energy supplies in 2017. We are moving away from fossil fuels, but not quickly.
Of the 252 million tons of oil equivalent (MTOE) energy consumption added in 2017, wind added 37 MTOE and solar added 26 MTOE. Thus, wind and solar amounted to about 25% of total energy consumption added in 2017. Fossil fuels added 67% of total energy consumption added in 2017, and other categories added the remaining 8%.
[2] World per capita energy consumption is still on a plateau.
In recent posts, we have remarked that per capita energy consumption seems to be on a plateau. With the addition of data through 2017, this still seems to be the case. The reason why flat energy consumption per capita is concerning is because oil consumption per capita normally rises, based on data since 1820.1 This is explained further in Note 1 at the end of this article. Another reference is my article, The Depression of the 1930s Was an Energy Crisis.
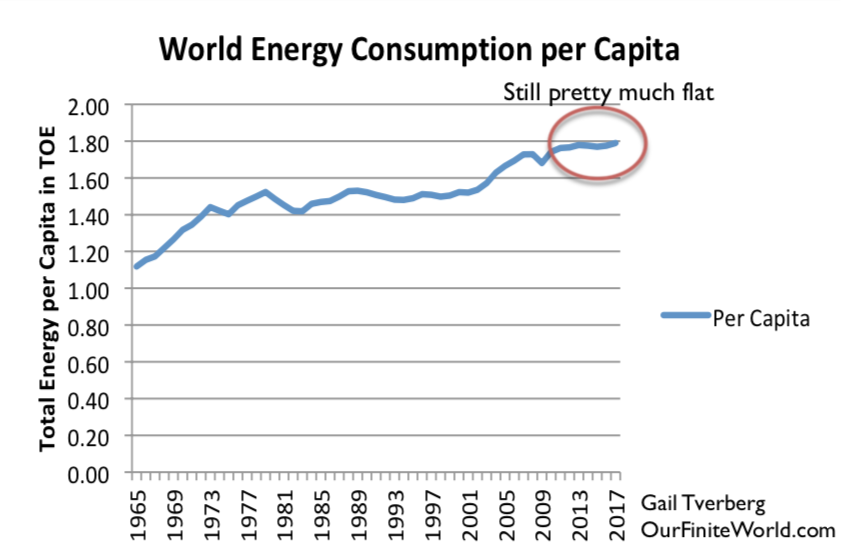
Figure 2. World energy consumption per capita, based on BP Statistical Review of World Energy 2018 data.
While total energy consumption is up by 2.2%, world population is up by about 1.1%, leading to a situation where energy consumption per capita is rising by about 1.1% per year. This is within the range of normal variation.
One thing that helped energy consumption per capita to rise a bit in 2017 relates to the fact that oil prices were down below the $100+ per barrel range seen in the 2011-2014 period. In addition, the US dollar was relatively low compared to other currencies, making prices more attractive to non-US buyers. Thus, 2017 represented a period of relative affordability of oil to buyers, especially outside the US.
[3] If we view the path of consumption of major fuels, we see that coal follows a much more variable path than oil and natural gas. One reason for the slight upturn in per capita energy consumption noted in [2] is a slight upturn in coal consumption in 2017.

Figure 3. World oil, coal, and natural gas consumption through 2017, based on BP Statistical Review of World Energy 2018.
Coal is different from oil and gas, in that it is more of a “drill it as you need it” fuel. In many parts of the world, coal mines have a high ratio of human labor to capital investment. If prices are high enough, coal will be extracted and consumed. If prices are not sufficiently high, coal will be left in the ground and the workers laid off. According to the BP Statistical Review of World Energy 2018, coal prices in 2017 were higher than prices in both 2015 and 2016 in all seven markets for which they provide indications. Typically, prices in 2017 were more than 25% higher than those for 2015 and 2016.
The production of oil and natural gas seems to be less responsive to price fluctuations than coal.2 In part, this has to do with the very substantial upfront investment that needs to be made. It also has to do with the dependence of governments on the high level of tax revenue that they can obtain if oil and gas prices are high. Oil exporters are especially concerned about this issue. All players want to maintain their “share” of the world market. They are reluctant to reduce production, regardless of what prices do in the short term.
[4] China is one country whose coal production has recently ticked upward in response to higher coal prices.

Figure 4. China’s energy production by fuel, based on BP Statistical Review of World Energy 2018 data.
China has been able to bridge the gap by using an increasing amount of imported fuels. In fact, according to BP, China was the world’s largest importer of oil and coal in 2017. It was second only to Japan in the quantity of imported natural gas.
[5] China’s overall energy pattern appears worrying, despite the uptick in coal production.
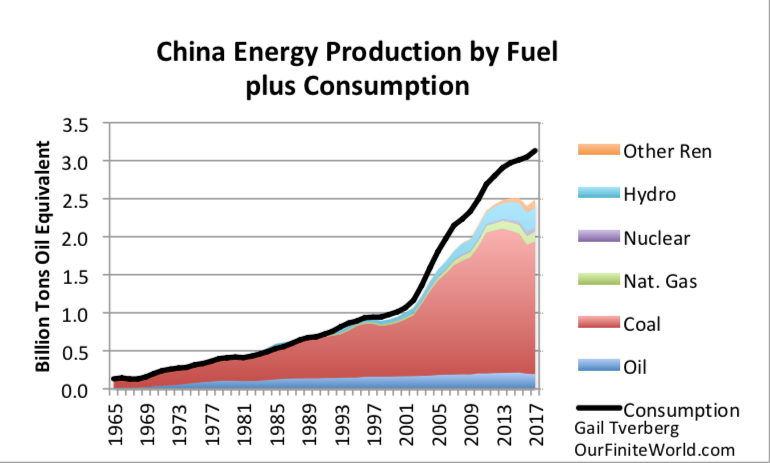
Figure 5. China’s energy production by fuel plus its total energy consumption, based on BP Statistical Review of World Energy 2018 data.
If China expects to maintain its high GDP growth ratio as a manufacturing country, it will need to keep its energy consumption growth up. Doing this will require an increasing share of world exports of fossil fuels of all kinds. It is not clear that this is even possible unless other areas can ramp up their production and also add necessary transportation infrastructure.
Oil consumption, in particular, is rising quickly, thanks to rising imports. (Compare Figure 6, below, with Figure 4.)

Figure 6. China’s energy consumption by fuel, based on BP Statistical Review of World Energy 2018.
[6] India, like China, seems to be a country whose energy production is falling far behind what is needed to support planned economic growth. In fact, as a percentage, its energy imports are greater than China’s, and the gap is widening each year.
The big gap between energy production and consumption would not be a problem if India could afford to buy these imported fuels, and if it could use these imported fuels to make exports that it could profitably sell to the export market. Unfortunately, this doesn’t seem to be the case.

Figure 7. India’s energy production by fuel, together with its total energy consumption, based upon BP Statistical Review of World Energy 2018 data.
India’s electricity sector seems to be having major problems recently. The Financial Times reports, “The power sector is at the heart of a wave of corporate defaults that threatens to cripple the financial sector.” While higher coal prices were good for coal producers and helped enable coal imports, the resulting electricity is more expensive than many customers can afford.
[7] It is becoming increasingly clear that proved reserves reported by BP and others provide little useful information.
BP provides reserve data for oil, natural gas, and coal. It also calculates R/P ratios (Reserves/Production ratios), using reported “proved reserves” and production in the latest year. The purpose of these ratios seems to be to assure readers that there are plenty of years of future production available. Current worldwide average R/P ratios are
- Oil: 50 years
- Natural Gas: 53 years
- Coal: 134 years
The reason for using the R/P ratios is the fact that geologists, including the famous M. King Hubbert, have looked at future energy production based on reserves in a particular area. Thus, geologists seem to depend upon reserve data for their calculations. Why shouldn’t a similar technique work in the aggregate?
For one thing, geologists are looking at particular fields where conditions seem to be right for extraction. They can safely assume that (a) the prices will be high enough, (b) there will be adequate investment capital available and (c) other conditions will be right, including political stability and pollution issues. If we are looking at the situation more generally, the reasons why fossil fuels are not extracted from the ground seem to revolve around (a), (b) and (c), rather than not having enough fossil fuels in the ground.
Let’s look at a couple of examples. China’s coal production dropped in Figure 4 because low prices made coal extraction unprofitable in some fields. There is no hint of that issue in China’s reported R/P ratio for coal of 39.
Although not as dramatic, Figure 4 also shows that China’s oil production has dropped in recent years, during a period when prices have been relatively low. China’s R/P ratio for oil is 18, so it theoretically should have plenty of oil available. China figured out that in some cases, it could import oil more cheaply than it could produce it themselves. As a result, its production has dropped.
In Figure 7, India’s coal production is not rising as rapidly as needed to keep production up. Its R/P ratio for coal is 137. Its oil production has been declining since 2012. Its R/P for oil is shown to be 14.4 years.
Another example is Venezuela. As many people are aware, Venezuela has been having severe economic problems recently. We can see this in its falling oil production and its related falling oil exports and consumption.
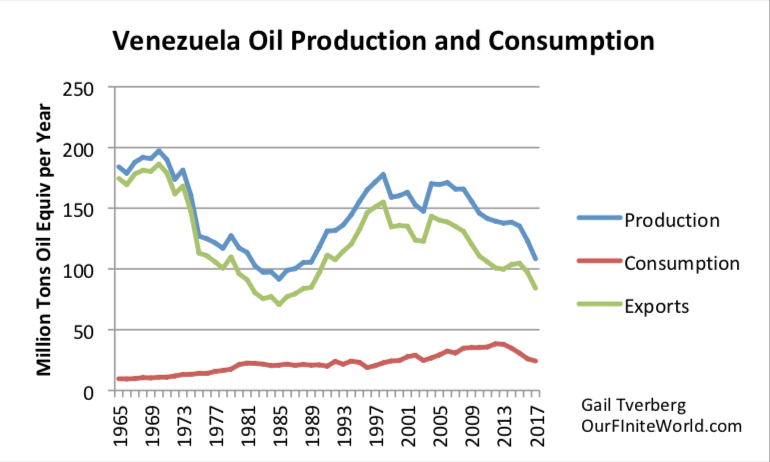
Figure 8. Venezuela’s oil production, consumption and exports, based on data of BP Statistical Review of World Energy 2018.
Yet Venezuela reports the highest “Proved oil reserves” in the world. Its reported R/P ratio is 394. In fact, its proved reserves increased during 2017, despite its very poor production results. Part of the problem is that proved oil reserves are often not audited amounts, so that proved reserves can be as high as an exporting country wants to make them. Another part of the problem is that price is extremely important in determining which reserves can be extracted and which cannot. Clearly, Venezuela needs much higher prices than have been available recently to make it possible to extract its reserves. Venezuela also seems to have had low production in the 1980s when oil prices were low.
I was one of the co-authors of an academic paper pointing out that oil prices may not rise high enough to extract the resources that seem to be available. It can be found at this link: An Oil Production Forecast for China Considering Economic Limits. The problem is an affordability problem. The wages of manual laborers and other non-elite workers need to be high enough that they can afford to buy the goods and services made by the economy. If there is too much wage disparity, demand tends to fall too low. As a result, prices do not rise to the level that fossil fuel producers need. The limit on fossil fuel extraction may very well be how high prices can rise, rather than the amount of fossil fuels in the ground.
[8] Nuclear power seems to be gradually headed for closure without replacement in many parts of the world. This makes it more difficult to create a low carbon electricity supply.
A chart of nuclear electricity production by part of the world shows the following information:
Figure 9. Nuclear electric power production by part of the world, based on BP Statistical Review of World Energy 2018. FSU is “Former Soviet Union” countries.
The peak in nuclear power production took place in 2006. A big step-down in nuclear power generation took place after the Fukushima nuclear power accident in Japan in 2011. Europe now seems to be taking steps toward phasing out its nuclear power plants. If nothing else, new safety standards tend to make nuclear power plants very expensive. The high price makes it too expensive to replace aging nuclear power plants with new plants, at least in the parts of the world where safety standards are considered very important.
In 2017, wind and solar together produced about 59% as much electricity as nuclear power, on a worldwide basis. It would take a major effort simply to replace nuclear with wind and solar. The results would not provide as stable an output level as is currently available, either.
Of course, some countries will go forward with nuclear, in spite of safety concerns. Much of the recent growth in nuclear power has been in China. Countries belonging to the former Soviet Union (FSU) have been adding new nuclear production. Also, Iran is known for its nuclear power program.
Conclusion
We live in challenging times!
Notes:
(1) There is more than one way of seeing that energy consumption per capita needs to rise, despite rising efficiency.
One basic issue is that enough energy consumption needs to get back to individual citizens, particularly citizens with few skills, so that they can continue to have the basic level of goods and services that they need. This includes food, clothing, housing, transportation, education and other services, such as medical services. Unfortunately, history shows that efficiency gains don’t do enough to offset several other countervailing forces that tend to offset the benefits of efficiency gains. The forces working against unskilled workers getting enough goods and services include the following:
(a) Diminishing returns ensures that an increasing share of energy supplies must be used to dig deeper wells or provide water desalination, to operate mines for all kinds of minerals, and to extract fossil fuels. This means that less of what energy is available can get back to workers.
(b) Governments need to grow because of promises that they have made to citizens. Retirement benefits are particularly an issue, as populations age. This takes another “cut” out of what is available.
(c) Increased use of technology tends to produce a much more hierarchical structure of the workforce. People at the top of the organization are paid significantly more than those near the bottom. Globalization tends to add to this effect. It is the low wages of those at the bottom of the hierarchy that becomes a problem because those workers cannot afford to buy the goods and services that they need to provide for themselves and their family.
(d) Increasing use of technology can often produce replacements for manual labor. For example, robots and computers can replace some jobs, leaving many would-be workers unemployed. The companies that produce the replacements for manual labor are often international companies that are difficult to tax. Governments can try to raise taxes to provide benefits to those left out by the economy because of the growing use of technology, but this simply exacerbates the problem described as (b) above.
(e) The world economy always has some countries that are doing better in terms of GDP growth than other countries. These countries are nearly always countries whose energy use per capita is growing. Current examples include China and India. If world resources per capita are flat, there must be other countries whose energy consumption per capita is falling. Examples today would include Venezuela, Greece and the UK. It is the countries with falling energy consumption per capita that have the more severe difficulties. Our networked world economy cannot get along without these failing economies.
Besides the issue of enough goods and services getting back to those with limited skills, a second basic issue is having enough energy-based goods and services to actually fulfill promises that have been made. One type of promise is debt and related interest payments. Another type of promise is that made by pension plans, whether government sponsored or available from private industry. A third type of promise is represented by asset prices available in the market place, such as prices of shares of stock and real estate prices.
The problem is that promises of all types can, in theory, be exchanged for goods and services. The stock of goods and services cannot rise very quickly, if energy consumption is only rising at the per-capita rate. Even if more money is issued, the problem becomes dividing up a not-very-rapidly growing pie into ever-smaller pieces, to try to fulfill all of the promises.
(2) With respect to oil, the one major deviation from its flat pattern occurred in the early 1980s, when world oil consumption fell by 11% between 1979 and 1983. This happened as the result of a concerted effort to change home heating and electricity production to other fuels. It also involved a change from large inefficient cars to smaller, more fuel efficient cars. After the 2007-2009 recession, there was another small step downward. This downward step may reflect less building of new homes and commercial spaces in some parts of the world, including the US.
Gail E. Tverberg graduated from St. Olaf College in Northfield, Minnesota in 1968 with a B.S. in Mathematics. She received a M.S. in Mathematics from the University of Illinois, Chicago in 1970. Ms. Tverberg is a Fellow of the Casualty Actuarial Society and a Member of the American Academy of Actuaries. Ms. Tverberg began writing articles on finite world issues in early 2006. Since March 1, 2007, Ms. Tverberg has been working for Tverberg Actuarial Services on finite world issues. Her blog is http://ourfiniteworld.com where this article originally published.