Vehicle drivers are familiar with crucial highway signs saying “WRONG WAY GO BACK”. A detailed analysis shows that global greenhouse gas (GHG) emissions in all key economic sectors of energy production and non-energy production are increasing whereas the worsening Climate Emergency demands urgently decreasing GHG emissions and ultimately net zero GHG emissions ASAP. The world is driving headlong in the wrong direction to certain disaster.
The main sources of greenhouse gas (GHG) emissions (2013) are electricity and heat (31%), agriculture (11%), transportation (15%), forestry (6%) and manufacturing (12%). GHG emissions sources can be put into 2 categories (A) Non-energy production (28%) and (B) Energy production (72%).
(A). Non-energy production (28%) includes the following: Bunker fuels (Mt CO2) 2.2%, Land-use Change & Forestry (Mt CO2) 6.0%, Waste (CO2-e) 3.0%, Agriculture (Mt CO2-e) 11.0%, Industrial processes (Mt CO2-e) 6.0%.
(B). Energy production (72%) includes the following: Electricity & Heat (Mt CO2) 31.0%, Transportation (Mt CO2) 15.0%, Manufacturing & Construction (MtCO2) 12.4%, Other Fuel Combustion (Mt CO2-e) 8.4%, Fugitive Emissions (Mt CO2-e) 5.2% [1].
Net global GHG emissions in 2013 totalled 48.3 Gt CO2-e , steadily increasing in a quasi-linear fashion from 39.8 Gt CO2-e in 2003 i.e. increasing by 8.5Gt CO2-e or by +21.4% over 10 years, or by an average of 0.85Gt CO2-e per year or an average of 1.9% per year [2]. From this we can estimate that net global GHG emissions totalled about 54.7 Gt CO2-e in 2019.
Fundamental to the worsening Climate Emergency is the refusal of the dominant neoliberal One Percenters to allow the cost of past and present carbon pollution to be met, preferring to pass these immense, rising and inescapable costs (Carbon Debt) on to future generations. Eminent economist Lord Nicholas Stern has described this refusal as “the greatest market failure in history” [3]. Pope Francis has demanded that the environmental and social cost of pollution be “fully borne” by the polluters [4, 5]. Climate economist Dr Chris Hope (120 Nobel Laureate University of Cambridge) estimated a damage-related Carbon Price of $200 per tonne CO2-e [6], with this equating to the upper estimate by Professor James Hansen (NASA and 96 Nobel Laureate Columbia University) and colleagues of the cost of drawing down CO2 from the atmosphere [7].
(A1). Bunker Fuel use (2.2% of total GHG emissions or 1.06 Gt CO2-e in 2013) has increased in recent years at 8.3% per year in terms of value.
Current wrong way. Bunker Fuel is the fuel oil for all shipping. Allied Market Research: “The global bunker fuel market was valued at $137,215.5 million [$137.2 billion] in 2017 and is expected to reach $273,050.4 million [$273.1 billion] by 2025, registering a CAGR [Compound Annual Growth Rate] of 9.4% from 2018 to 2025” [8]. The increase in value in 2008-2025 is $135.9 billion (99.1% over 8 years) or an average of $17.0 billion pa or 8.3% per year. At a Carbon Price of $200 per tonne CO2-e, removal of the 1.06 Gt CO2 introduced into the atmosphere by burning Bunker Fuel in 2013 = 1.06 Gt CO2 x $200/ tonne CO2 = $212 billion, this exceeding the expected market value of Bunker Fuel in 2020 of $182 billion [8].
Required actions. Bunker Fuel use is increasing. Net zero GHG emissions for Bunker Fuel use could be achieved by compensatory Re-afforestation or better still by preserving existing old growth forests. While bulk movement of grains is crucial for survival of many the movement of perishable vegetable matter (e.g. grapes from California to grape producing Australia) is an unwarranted and wasteful indulgence. Even within countries people should ideally use seasonal and local food if possible.
(A2). Waste CO2-e from anaerobic bacterial decomposition of biological material may be 7.0 Gt CO2-e per year and is increasing at 135 Mt CO2-e per year.
Current wrong way. Landfill gas is about 50% CH4 and 50% CO2 [9]. Waste CO2-e is mainly CH4 from anaerobic bacterial decomposition of biological material (e.g. in metropolitan waste landfill sites ) and was estimated at 3.0% of 48.3 Gt CO2-e (2013) or 1.4 Gt CO2-e [1]. However the Global Warming Potential of CH4 relative to the same mass of CO2 (formerly taken as 21 on a 100 year time scale) has been re-assessed as 105 on a 20 year time scale and with aerosol impacts considered [10]. On this basis the Waste CO2-e from anaerobic bacterial decomposition of biological material may be 5 x 1.4 Gt CO2-e = 7.0 Gt CO2-e per year (on a 20 year time frame). CH4 emissions are further considered below under Land-use & Forestry and under Fugitive Emissions. The Global Methane Initiative (2010): “While methane is in the atmosphere for a shorter period of time and is emitted in smaller quantities than CO2, its ability to trap heat in the atmosphere, which is called its “global warming potential,” is 21 times greater than that of CO2 [on a 100 year time frame] … Globally, landfills are the third largest anthropogenic source of methane, accounting for approximately 11 percent of estimated global methane emissions or nearly 799 Mt CO2-e in 2010” [11]. Waste Management Research (2013): “Methane emissions from landfills can be estimated by using the Intergovernmental Panel on Climate Change (IPCC) methodology. Less than 5% of global GHG comes from the waste sector, of which landfill methane is the largest source. The IPCC has estimated that landfill methane will reach 795 Mt CO2e and 910 Mt CO2e in 2015 and 2020, respectively, out of approximately 300 Mt CO2e emitted by landfills and dumps in developing countries in south and east Asia. In developed countries, LFG emissions have been stabilized in response to stringent regulations, yet methane emissions are expected to continue increasing in developing countries as more waste goes to landfills that lack sufficient (and in some cases, any) emission control systems” [12]. From this latter data one can estimate that landfill waste gas is increasing at 27 Mt CO2-e per year i.e. 5 x 27 = 135 Mt CO2-e per year on a 20 year time frame. At a Carbon Price of $200 per tonne CO2-e, the estimated Carbon Debt from Waste is $200 per tonne CO2-e x 7.0 Gt CO2-e = $1,400 billion annually.
Required actions. The solutions are (a) to collect and usefully burn CH4 from waste landfill, (b) to ensure that all waste biological material ends up in aerobic composting, and (c) drastically cut down on food wastage (thus it is estimated that 40% of food is wasted in the US ) [13].
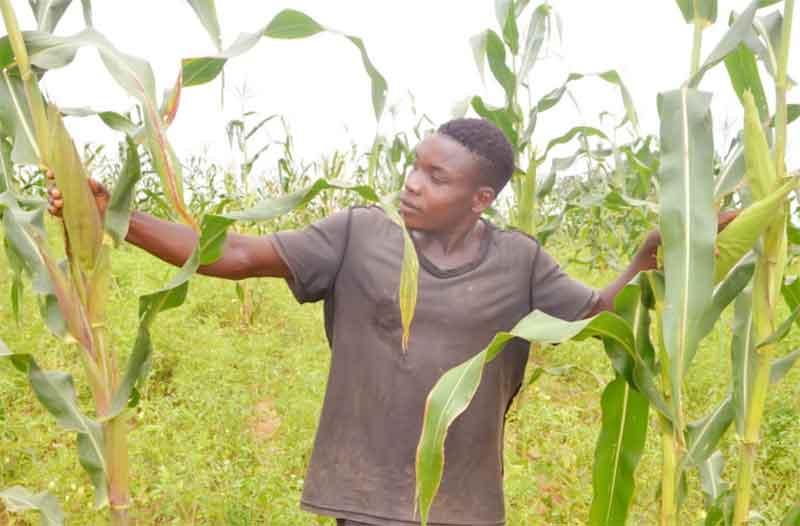
(A3). Agricultural GHG emissions (CO2-e) revised upwards to 13.7 Gt CO2-e in 2013 and are increasing at 0.7% per year.
Current wrong way. 2013 GHG emissions from agriculture ostensibly totalled 0.11 x 48.3 Gt CO2-e = 5.31 Gt CO2-e, with 40% (2.12 Gt CO2-e) due to CH4 from livestock. The World Resources Institute (2019): “The majority of agricultural production emissions come from raising livestock. More than 70 billion animals are raised annually for human consumption. The biggest single source is methane from cow burps and manure. Enteric fermentation—a natural digestive process that occurs in ruminant animals such as cattle, sheep and goats—accounts for about 40% of agricultural production emissions in the past 20 years… Emissions from agricultural production currently account for 11% of global greenhouse gas emissions and have risen 14% since 2000” [14]. From this data we can estimate an annual percentage increase of 14%/19.25 years = 0.73% per year. However the estimate of 5.13 Gt CO2-e of Agricultural GHG emissions in 2013 [14] assumes a Global Warming Potential (GWP) for methane (CH4) of 21 relative to the same mass of CO2 (on a 100 year time frame) whereas on a 20 year time frame and with aerosol impacts considered is 105 [10]. Accordingly the ostensible 0.4 x 5.13 Gt CO2-e = 2.12 Gt CO2-e (40% of the total) due to livestock (2013) should actually be 5 times larger ( i.e. 5 x 2.12Gt CO2-e = 10.60 Gt CO2-e) and the estimated Agricultural GHG emissions should be increased on this basis alone to 10.60 + 0.6 x 5.13 = 13.68 Gt CO2-e per year (2013).
The following Agriculture-related parameters are going in the wrong direction in a fashion that is quasi-linear as a function of time and Humanity must urgently address this disastrous trend [15-18]:
Freshwater resources per capita (1,000 metre3 ): 8.0 (1992) to 5.9 (2014), -25.4% overall, – 12.0 % per decade, -0.095 per year; 4,400 metre3 in 2030.
Reconstructed marine catch (Mt per year): 121 (1992) to 113 (2011), -6.6%, overall, – 3.5% per decade, -0.42 per year; 105 million tonnes marine catch per year in 2030.
Ocean dead zones (number of affected regions): 360 (1992) to 660 (2008), +83.3% overall, +52% per decade, +11.5 per year; 913 ocean dead zones by 2030.
Vertebrate species abundance (% of 1970): 59.5 (1992) to 43.5 (2010), – 26.9% overall , -14.9% per decade, -0.89 per year; 27.5% of 1970 level by 2030.
Human population (billion individuals): 5.50 (1992) to 7.45 (2016), + 35.5% overall, +14.8% per decade, 0.081 per year; 8.58 billion human individuals in 2030.
Ruminant population (billion individuals): 3.25 (1992) to 3.90 (2014), +20.0% overall, +9.1% per decade, +.03 per year; 4.38 billion ruminant individuals in 2030
Ruminant livestock (billion individuals): 2.86 billion (1979) to 3.93 billion (2017) (+ 8.72% per decade, +0.87% per year and +0.028 per year).
Per capita meat production (kg per year): 30 (1979) to 44 (2018) (+11% per decade, +1.1% per year, +0.36 per year ) .
World GDP (trillion current US$/year). The data appear to fall into to 2 successive upward linear phases with an upward inflection in about 2000: 10.0 (1979) to 32.5 (1998) and 37.5 (2001) to 86.3 (2018), with growth rates of $1.18 trillion per year and $2.87 trillion per year, respectively, and an overall growth of + 80.5% /10 years ( +8.1% per year and +$1.96 trillion per year).
Global tree cover loss (million hectares per year): The data fall into 2 successive upward linear phases with an apparent short low-rate period in the late 2000s: 14 (2001) to 18 (2005) and 18 (2010) to 27.5 (2018) with corresponding rates of loss of 1.0 and 1.2 million hectares per year, respectively.
Brazilian Amazon forest loss (millions hectares per year) was in the range 1-3 million hectares per year in the period 1988-2008 (very scattered data) and then fell to about 0.7- 0.9 million hectares per year in the period 2009-2018 ( – 24.3% /10 years, -2.4% per year).
Nitrous oxide (N2O parts per billion) increased in a quasi-linear fashion from 301 (1979) to 331 (2018) for an average of 0.77 ppb per year (+2.46% per decade, +0.28% per year). Using this average, extrapolation yields a 2030 value of 340 ppm N2O, noting that N2O is derived from oxidation of nitrogenous agricultural fertilizers and has a Global Warming Potential (GWP) relative to the same mass of CO2 of 289 on a 20-year time frame (298 on a 100 year time frame).
Sea level change relative to the 20-year mean (mm) increased linearly from – 34 (1993) to + 46 (2017) to give a rise of 3.33 mm per year (+31.4 mm per decade or +3.14 per year according to the paper). Extrapolation yields a sea level rise in 2030 of 89 mm (relative to that in 2005) and 123 mm (relative to that in 1993).
Extreme weather/climate/hydrological events (numbers per year) have been monotonically increasing in a tri-phasic quasi-linear fashion from 200 (1980) to 400 (1994) (an increase of 14.3 events per year), a constant of circa 400 per year in the period 1994-2004, and then a linear increase from 440 (2004) to 800 (2019) (an increase of 32.7 events per year) (+ 43.8% per decade and +4.4% per year overall). Assuming an increase of 32.7 events per year , extrapolation yields 1,160 events in 2030 or more than 3 such events per day.
Annual losses due to weather/climate/hydrological events ($billions) and excluding 2 exceptional outlier events, increased in a quasi-linear fashion from 20 (1980) to 196 (2018) for a rate of 4.63 per year (+83.7% per decade, 8.4% per year). Extrapolation yields an annual cost of $2,452 billion in 2030.
Required actions. Conversion efficiency (kg grain to produce 1 kg gain in live weight) is as follows: herbivorous farmed fish (e.g. carp, tilapia, catfish; less than 2), chicken (2), pork (4), and beef (7) [19, 20]. Methanogenic beef production is contraindicated because of the huge inefficiency in grain to meat conversion as well as the huge contribution to GHG emissions. Indeed World Bank analysts have re-assessed the contribution of animal husbandry and associated land clearing to annual global GHG emissions, considering the GWP for CH4 on a 20 year time frame – on this basis the total annual GHG emissions in 2009 rose from 41.8 Gt CO2-e to 63.8 Gt CO2-e [21]. Ripple et al recommend re food: “Eating mostly plant-based foods while reducing the global consumption of animal products” [17]. There must be a global vegetarian diet and replacement of cow-derived milk with plant substitutes (soybean and almond milk). The deadly food-for-fuel Biofuel Genocide obscenity must be stopped. Food adequacy involves cessation of global inequity, population growth, economic growth, GHG pollution, sea level rise, soil salinization, deforestation and damaging land use [18, 19]. We are all one Humanity and all decent people accept the proposition of the American Declaration of Independence that “all men are created equal and have an inalienable right to life, liberty and the pursuit of happiness”. However 2009 per capita meat consumption in kilograms per person was 120.2 for the US as compared to 4.4 for India [22], noting that most Agriculture sector emissions come from raising livestock [14].
(A4). Land-use Change and Forestry emissions revised upwards to 5.6 Gt CO2-e and loss of 1.2 million hectares of forest photosynthetic CO2 sequestration per year.
Current wrong way. Global Land-use and Forestry emissions in 2013 were estimated at 6.0% of the total i.e. at 0.06 x 48.3 Gt CO2-e = 2.9 Gt CO2. However World Bank analysts have re-assessed the contribution of animal husbandry and associated land clearing to annual global GHG emissions, considering the GWP for CH4 being 105 on a 20 year time frame. On this basis the total annual GHG emissions in 2009 rose from 41.8 Gt CO2-e to 63.8 Gt CO2-e with “overlooked” land use GHG emissions amounting to over 4.2% of the revised total i.e. 0.042 x 63.8 Gt CO2-e = 2.7 Gt CO2-e [21]. Thus the revised global Land-use and Forestry emissions in 2013 total 2.9 + 2.7 = 5.6 Gt CO2-e. There is presently loss of 1.2 million hectares of forest photosynthetic CO2 sequestration per year.
The following Land-use- and Forestry-related parameters are going in the wrong direction in a fashion that is quasi-linear as a function of time and Humanity must urgently address this disastrous trend [15-18]:
Total forest (million hectares): 4.110 (1992) to 3.990 (2016), –2.9% overall, -1.2% per decade, -0.12% per year; 3.92 million hectares left by 2030.
Vertebrate species abundance (% of 1970): 59.5 (1992) to 43.5 (2010), – 26.9% overall , -14.9% per decade, -0.89 per year; 27.5% of 1970 level by 2030.
Human population (billions): 4.35 (1979) to 7.65 (2018), +75.9% overall, +19.5% per decade, + 0.085 billion per year, and an estimated 9.07 billion human population in 2030 (assuming an average increase of +84.6 million per year, noting that the increase in population was linear over the period 1979-2018).
Global tree cover loss (million hectares per year): The data fall into 2 successive upward linear phases with an apparent short low-rate period in the late 2000s: 14 (2001) to 18 (2005) and 18 (2010) to 27.5 (2018) with corresponding rates of loss of 1.0 and 1.2 million hectares per year, respectively. Extrapolation using the latter faster latter rate yields an estimated loss rate of 41.9 million hectares of tree cover loss per year by 2030.
Brazilian Amazon forest loss (millions hectares per year) was in the range 1-3 million hectares per year in the period 1988-2008 (very scattered data) and then fell to about 0.7- 0.9 million hectares per year in the period 2009-2018 (- 24.3% /10 years, -2.4% per year).
Area burned in the United States (million hectares per year) involves very scattered data. However , assuming the authors’ quasi-linear best fit involving an increase from 0.9 (1983) to 3.2 (2018) , one can estimate an increase of 0.066 million hectares per year (+ 44.1% per decade, +4.4% per year). Extrapolating from this average yields an estimate of 4.0 million hectares burned in 2030.
Required actions. Ripple et al (2019): “We must protect and restore Earth’s ecosystems. Phytoplankton, coral reefs, forests, savannas, grasslands, wetlands, peatlands, soils, mangroves, and sea grasses contribute greatly to sequestration of atmospheric CO2” [17]. There must be cessation of land clearing and deforestation coupled with large-scale ecosystem restoration and re-afforestation. It is possible to sequester 12 Gt biochar (charcoal, carbon C) annually (from the anaerobic pyrolysis of forestry and agricultural cellulosic waste at 400-700C, and this can more than compensate for the present 9 Gt carbon (33 Gt CO2-e) pollution annually from industry [23]. It should be noted that the south eastern Australian Eucalyptus forests are the best forest carbon sinks in the world and must be preserved [24]. Tropical forests have now reached or are close to reaching a tipping point of generating more CO2 than they sequester [25-27]. Crucially it is necessary to halt and reverse the human population growth that underlies increased economic production, increased land use, increased deforestation and associated increased biodiversity loss. The species extinction rate is now 100-1,000 times greater than normal [28]. The –28.9% decline in vertebrate species abundance over the last quarter century means that if these changes continue at the same rate then there will be a near 100% decline in non-human vertebrate species abundance in the coming century [15-18, 29]. From a fundamental, qualitative perspective we must not destroy what we cannot replace, and all species are priceless.
(A5). Industrial processes (steel and cement manufacture) generated 6.9 Gt CO2-e in 2019, with GHG emissions from steel and cement production presently increasing by 3.4% and 1.2%, respectively.
Current wrong way. In 2013 Industrial processes generated 6.0% of global GHG pollution or 0.06 x 48.3 Gt CO2-e = 2.9 Gt CO2-e [1, 2]. Steel and cement production are major sources of greenhouse gas (GHG) pollution. Thus global crude steel production reached 1.87 Gt in 2019, up by 3.4% compared to 2018 [30]. In 2008 steel production accounted for 4-5 % of global GHG emissions, with 1.9 tons of CO2 produced per ton of steel produced [31]. Thus production of 1.87 Gt steel in 2019 was associated with emission of 3.55 Gt CO2-e. Cement production from limestone (Ca CO3) is the source of 5-8% of global GHG pollution. Producing 1 tonne of cement from heating limestone (CaCO3) and other minerals (e.g. calcium silicate) yields 0.82 tonne CO2. Global CO2 emissions from cement manufacture was recently estimated to currently total 1.5 Gt CO2 per year or 4.5% of global CO2 production of 33 Gt CO2. [32, 33]. Cement production increased from 3.31 Gt (2010) to 4.05 Gt (2018) and thence to 4.10 in 2019. While cement production increased by 23.9% over the last decade, it increased by only 1.2% in 2019 [34]. In 2019 CO2 from cement and steel manufacture totalled 3.55 Gt (steel) + 3.36 Gt (cement) = 6.91 Gt CO2 or 12.6 % of net global CO2 emissions of 54.7 Gt CO2-e in 2019. In 2019 GHG emissions from steel and cement production increased by 3.4% and 1.2% respectively.
Required actions. Steel can be manufactured based on renewable energy using hydrogen (H2) as a reductant. Indeed Swedish steel giant Svenskt Stål AB (Swedish Steel or SSAB) is to use renewable hydrogen to produce fossil-free steel by 2026 [35] . Replacing cement (a source of 5-8% of global GHG pollution) will be more difficult. However a water-resistant magnesium oxychloride cement (MOC) is being developed as a green alternative to Portland cement [33]. Of course steel and cement use can be substantially decreased by reducing economic output through negative population growth and associated economic de-growth that are demanded by the worsening Climate Emergency [29].
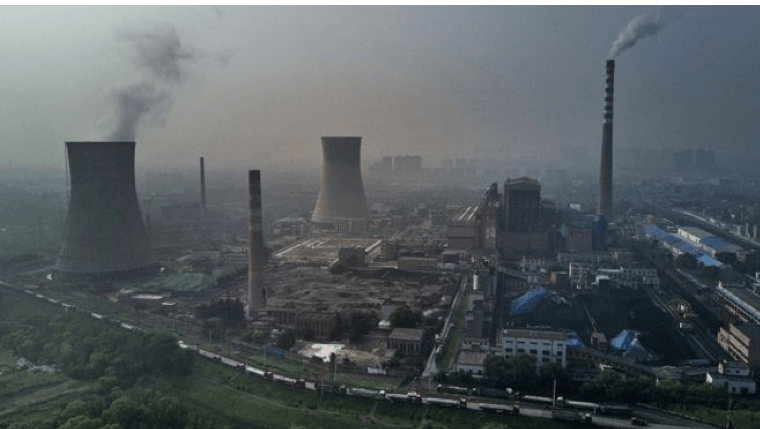
Energy sector CO2 emissions overall total 33.1 Gt CO2 (2018) and are increasing at 1.7% per year (2018).
Current wrong way. The IEA has estimated energy sector GHG emissions over the period 1990-2018: “Global energy-related CO2 emissions grew 1.7% in 2018 to reach a historic high of 33.1 Gt CO2. It was the highest rate of growth since 2013, and 70% higher than the average increase since 2010” [36]. The energy sector GHG emissions rose in a quasi-linear fashion from 20.5 Gt CO2 (1990) to 33.2 Gt CO2 (2018) for an overall rate of 0.45 Gt CO2 per year or an average increase of 1.7% per year.
Required actions. Ripple et al. (2019): “There should be a rapid transition away from dirty energy (coal, oil, gas and other carbon fuels) to 100% renewable energy, with this associated with assistance to developing economies , cessation of fossil fuel exploitation, and application of proper Carbon Prices” [17, 18]
(B1). Electricity & Heat generated 15.0 Gt CO2-e or 31.0% of annual global GHG emissions (2013) and annual coal, gas, and imported oil use are presently increasing by 3%, 4.6% and 3.5%, respectively.
Current wrong way. In 2013 GHG emissions from the Electricity & Heat sector constituted 31.0%, of annual global GHG emissions i.e. 0.31 x 48.3 Gt CO2-e = 15.0 Gt CO2-e.
Coal. According to the International Energy Agency (IEA) (2019): “Coal power generation increased 3% in 2018 (similar to the 2017 increase), and for the first time crossed the 10 000 TWh [energy] mark. Coal remains firmly in place as the largest source of power at 38% [38.5%] of overall generation. Growth was mainly in Asia, particularly in China and India. That said, investment in coal-fired power declined by nearly 3% to the lowest level since 2004, and final investment decisions for new plants continue to decline. Coal-fired generation without CCUS needs to decrease 5.8% per year to 2030 to be in line with the SDS [Sustainable Development Scenario 2000-2040]” [37, 38]. Total global energy production in 2018 was accordingly 10,000TWh/0.385 = 26,000 TWh [37]. GHG emissions from coal use went from 8.3 Gt CO2 (1990) to 14.6 Gt CO2 (2018) with an average increase of 0.23 Gt CO2 per year or 2.0%. GHG emissions from coal use went from 14.2 Gt CO2 (2016) to 14.6 Gt CO2 (2018) with an average increase of 0.2 Gt CO2 per year or 1.4% [36].
Gas. The IEA: “Natural gas had a remarkable year in 2018, with a 4.6% increase in consumption accounting for nearly half of the increase in global energy demand. Since 2010, 80% of growth has been concentrated in three key regions: the United States, where the shale gas revolution is in full swing; China, where economic expansion and air quality concerns have underpinned rapid growth; and the Middle East, where gas is a gateway to economic diversification from oil… Gas-fired power generation increased 4% in 2018, led by strong generation growth in the United States and China. At around 6100 TWh, gas accounts for 23% of overall power generation” [39]. Gas use has increased in a quasi-linear fashion in the period 1990-2017 from 43.892 x 10¹⁸ J in1990 to 69.888 x 10¹⁸ J in 2017 at an average rate of 0.96 x 10¹⁸ joules (J) per year ( 844.1 Mt gas in 1990 to 1,344.0 Mt gas in 2017 at an average increase of 18.5 Mt gas per year or 1.7% pa) [38]. Extraordinarily the IAE predicts very little change in gas usage between 2018 and 2040 [39].
Oil. Imported oil use increased from 1,532.6 ktoe (kilotonne of oil equivalent) in 1990 to 2,319.0 ktoe in 2017 with an average rate of increase of 29.1 ktoe per year. In the period 2014-2017 imported oil increased by 3.5% per year. The kilotonne of oil equivalent (ktoe) is a unit of energy defined as the amount of energy released by burning one kilotonne of crude oil and is about 42,000 gigajoules. The IEA predicts an increase in oil usage in the period 2018 to 2040: “Under the Stated Policies Scenario,
oil use in passenger cars peaks in the late 2020s… However there is no definitive peak in oil use overall, as there are continued increases in petrochemicals, trucks and the shipping and aviation sector” [40].
Fugitive emissions of CH4 from oil and gas use. The IEA states that “Methane emissions from the oil and gas sector reached close to 80 Mt (or 2.4 billion tonnes of CO2 equivalent) in 2017. This is equal to 6% of global energy sector GHG emissions [i.e. 6% of 40 Gt CO2 per year]. Emissions remain high despite initial industry-led initiatives and government policies announced recently” [40]. However this assumes a Global Warming Potential (GWP) for methane (CH4) of 2,400 Mt CO2-e/80 Mt CH4 = 30 (on a 100 year time frame) whereas the GWP of CH4 relative to the same mass of CO2 is 105 with a 20 year time frame and including aerosol impacts [10]. Assuming a GWP for CH4 of 105, at 2.6% CH4 leakage the greenhouse effect of the leaked CH4 is the same as the greenhouse effect from burning the remaining 97.4% of the gas [41, 42].
In 2018 global natural gas production was 3,868 bcm (billion cubic metres) or 3,326 Mt oil-equivalent and the growth rate was +5.2% per year [43]. Combustion of 1 tonne of CH4 (85% of natural gas) yields 2.75 tonne CO2 as compared to combustion of 1 tonne of carbon (about 90% of coal) yielding 3.7 tonne CO2 and 1 tonne of saturated hydrocarbon ((CH2)n) yielding 3.1 t CO2. Thus in 2018 CO2 emissions from burning annual gas production of 3,326 Mt oil-equivalent = 3,326 Mt oil-equivalent x 3.1 t CO2/t oil = 10,331 Mt CO2. Assuming a GWP for CH4 of 105, at 2.6% CH4 leakage the greenhouse effect of the leaked CH4 is the same as the greenhouse effect from burning the remaining 97.4% of the gas [41, 42]. Accordingly the GHG effect from a 2.6% gas leakage is 0.974 x 10,331 Mt CO2 = 10.1 Gt CO2-e. Applying the same approach, the estimated for Fugitive Emissions in 2013 was 8,732 Mt CO2-e, which is or 8.7 Gt/2.4 Gt = 3.6 times greater than the IEA estimate given above for oil and gas fugitive emissions (indeed this is underestimated because gas leakage in the US is estimated at 5.4% [44-46]).
Required actions. Things that need to be urgently implemented in the Electricity & Heat sector include 100% renewable energy (with appropriate energy storage back-up), cessation of use of coal, gas, oil and other carbon fuels, and increased energy efficiency, Crucially, there must be cessation of public lying by fossil fuel lobbyists. Thus patently false lying by commission about asserted “clean coal”, “clean gas”, “cleaner gas” and a “coal to gas transition” must be called out, as indeed must be lying by omission about science-based accounting of GHG emissions (e.g. about fugitive emissions that are much greater than admitted).
(B2). Transportation generated 7.2 Gt CO2 or 15.0% of annual global GHG emissions (2013) with annual growth of about 3.1% for the global truck market.
Current wrong way. Transport accounts for 7.2 Gt CO2 or 15.0% of annual global emissions (2013). According to Deloitte: “From now to 2024, annual growth of > 3% is expected in the global truck market, mainly driven by global GDP growth, estimated at 3.3% per year… Between 2014 and 2024 the global truck market is expected to continue growing at a fairly low rate of 3.1% per year. The Indian market will be the main driver” [47]. According to IBIS World: “Over the five years to 2019, rising per capita income is expected to drive revenue growth for the Global Car and Automobile Sales industry. The industry’s dependency on employment rates, global consumer spending, financing rates and the world price of crude oil make it vulnerable to economic shifts. During the period, the United States and many other developed nations have experienced stable economic growth, leading to increased consumer demand for big-ticket purchases, such as vehicles. As a result, industry revenue is expected to grow at an annualized rate of 2.7% to $4.0 trillion over the five years to 2019, including revenue growing 2.3% in 2019 alone” [48].
The IEA on rail: “Global demand for transport is growing fast. Given present trends, passenger and freight activity will more than double by 2050. Such growth is a token of social and economic progress, but it carries with it greater energy demand and increased CO2 emissions and atmospheric pollutants… The transport sector is responsible for more than half of global oil demand and around one-quarter of global CO2 emissions from fuel combustion. Therefore changes in transportation are fundamental to achieving energy transitions globally. Yet while rail is among the most energy efficient modes of transport for freight and passengers, it is often neglected in public debate… Today, three-quarters of passenger rail transport activity takes place on electric trains, which is an increase from 60% in 2000 – the rail sector is the only mode of transport that is widely electrified today. This reliance on electricity means that the rail sector is the most energy diverse mode of transport” [49]. In terms of trillion passenger-km the rail sector has steadily grown from 2.15 (1995) to 4.05 (2016), a growth rate of 0.1 trillion passenger-km per year. However the diesel train sector has also grown, albeit modestly, from 0.9 (1995) to 1.23 (2016) for an average of +0.016 trillion passenger-km per year. Of course a substantial proportion of the electrified global train systems is powered by burning fossil fuels (see B1).
Required actions. Clearly we should be moving towards 100% renewable energy sources, electric vehicles, rail not road, transport energy efficiency, and public transport not private transport.
(B3). Manufacturing & Construction emitted 6.0 Gt CO2-e in 2013 and are increasing at 6.7% and 3.9% annually, respectively.
Current wrong way. McKinsey Global Group (2012): “A decade into the 21st century, the role of manufacturing in the global economy continues to evolve. We see a promising future. Over the next 15 years, another 1.8 billion people will enter the global consuming class and worldwide consumption will nearly double to $64 trillion. Developing economies will continue to drive global growth in demand for manufactured goods, becoming just as important as markets as they have been as contributors to the supply chain. And a strong pipeline of innovations in materials, information technology, production processes, and manufacturing operations will give manufacturers the opportunity to design and build new kinds of products, reinvent existing ones, and bring renewed dynamism to the sector” [50]. This estimate corresponds to an average annual growth for Manufacturing of 100/15 = 6.7% per year. Similarly PwC states re Construction : “PwC has sponsored a new report – Global Construction 2030 – which forecasts that the volume of construction output will grow by 85% to $15.5 trillion worldwide by 2030, with three countries, China, US and India , leading the way and accounting for 57% of all global growth. The benchmark global study, the fourth in a series from Global Construction Perspectives and Oxford Economics, shows average global construction growth of 3.9% pa to 2030, outpacing that of global GDP by over one percentage point, driven by developed countries recovering from economic instability and emerging countries continuing to industrialize” [51]. Manufacturing & Construction accounted for 0.124 x 48.3 Gt CO2-e = 6.0 Gt CO2 in 2013.
Required actions. Massive harm to the environment and biodiversity has occurred due to continuing carbon pollution, population growth and economic growth. It is clear that zero growth in these areas is insufficient and that there must be negative carbon pollution (atmospheric CO2 draw-down to a safe and sustainable 300 ppm CO2 from the present dangerous and damaging 412 ppm CO2 ), negative population growth (circa 50% population decline) and negative economic growth (circa 50% degrowth) to halt and reverse this worsening disaster [29]. Taking world coral as a “canary in the coal mine”, the 320 ppm CO2 at which coral reefs started to decline was reached in 1965, at which time the world’s population was 3.340 billion as compared to the present 7.6 billion [29]. Even if per capita GHG pollution remained the same, increasing population would see GHG pollution from attendant economic activities would increase. Further, while the low birth-rate rich North could live more modestly, the impoverished and high birth-rate South needs an increase in per capita income to enable circumstances in which birth rate can be reduced (high female literacy, higher infant survival and economic security) [29]. Professor Dabo Guan (School of International Development, University of East Anglia, UK) (2016) has commented thus on inescapable limits to growth: “For everyone in the world to have an American lifestyle, we would need seven planets, and three to live as Europeans” [52]. The European population is declining but the African population is expanding impossibly.
(B4). Other Fuel Combustion was 4.1 Gt CO2 in 2013 and “food for fuel” biofuel is increasing at 9.7% pa.
Current wrong way. In 2013 Other Fuel Combustion was 0.084 x 48.3 Gt CO2-e = 4.1 Gt CO2-e. Other Fuel Combustion includes burning of biofuel (e.g. ethanol and biodiesel), wood, other biomass and of cattle dung (the latter notably in Developing countries in Africa and South Asia). The Trump-subverted US Environment Protection Authority (EPA) has falsely declared that burning wood is carbon neutral – it is not because felling and burning trees not only releases sequestered carbon but also exposes huge stores of soil carbon to oxidation and stops further centuries of ongoing photosynthesis by the trees thus destroyed and subsequent carbon storage in wood and soil [53]. The World Bioenergy Association (2016): “Biomass for energy originates from a variety of sources classified into forestry, agriculture and waste streams. Some of the potential sources include: crops for biofuels, energy grass, short rotation forests, woody biomass and residues, herbaceous by-products and municipal solid waste. Globally, in 2012, the biggest share of biomass for energy came from forests – almost 49 EJ out of a total supply of 56.2 EJ. The current global energy supply is about 560 EJ [560 x 1018 J] … In 2012, biomass from forests and other areas with trees contributed 49EJ to the global energy supply. The lion share of this biomass is used in Asia and Africa… The contribution of biomass to primary energy can be increased from 56 EJ in 2012 to about 150 EJ by 2035 [7.3% per year]” [54].
The total global land area (2012) is 13,019 million hectares (13,019 Mha), this including 4,922 Mha (agriculture), 4,022 Mha (forest) and 4,075 Mha (other land). Of the agricultural land 1,396 Mha is arable, 164 Mha are for permanent crops, and 3,362 Mha are for pastures and meadows. In the period 2000 – 2005 the average annual gain of forest area was 5.7 Mha, this corresponding to an annual increase of 5.7 Mha x 100/ 4,000 Mha = 0.14% pa [54]. The World Bioenergy Association: “The 1.5% increase in total primary energy supply during 2016-17 has been matched by coal, oil and natural gas while renewables are lagging behind (0.7%). This trend appears to continue to 2018 and 2019 as well… Among [assertedly] renewable energy sources, bioenergy (energy from bio-based sources) is the largest. In 2017, bioenergy accounted for 70% of the renewable energy consumption… In 2017, 596 TWh of biopower [electricity from biomass] was produced globally which is an increase of 25TWh (+ 4%) over the previous year” [55].
Global biofuel production grew at an average rate of 9.2% per year over the period 2000-2018 and grew by 9.7% pa in 2017-2108 [56]. Biofuel is bad because it food for fuel in a hungry world that is set to become hungrier as population increases, the Developing World middle class increases, arable land decreases and water for agriculture decreases [57]. Biofuel, including bio-ethanol and bio-diesel production, generates a huge Carbon Debt from destruction of the balanced Carbon Cycle in swathes of wild nature [58-60].
Ignored in this analysis is inadvertent fuel combustion in ever-worsening, climate change-driven forest fires in California , Southern Europe, the Amazon, South East Asia, and Australia. Australia is among world leaders in 16 areas of climate criminality and with a mere 0.33% of the world’s population contributes 5.4% of global annual GHG emissions (exported GHG emissions included) [61, 62]. Taking land use and CH4 emissions into account, Australia’s annual Domestic GHG emissions total 1,423 Mt CO2-e (ignoring the 2019-20 bushfire contribution of 750 Mt CO2-e in 1 year [23]) – but the endlessly mendacious Australian Coalition Government claims annual Domestic emissions of 540 Mt CO2-e by failing to properly account for CH4 leakage (underestimating likely fugitive emissions by a factor of 8-54), land use, the CH4 Global Warming Potential on a 20 year time frame of 105, and ignoring the huge contribtion by bushfires [61, 62].
Required actions. Cellulosic biomass, sugar and plant-derived oil should simply not be used as biofuel in a hungry world. Human energy requirements can be met by genuine renewable energy (hydroelectric, solar PV, solar thermal, wind, tide, wave and geothermal) with hydrological, molten salts, battery and other energy storage. Nuclear waste and security issues aside, conventional nuclear power is not an option because the uranium and thorium ore resources are non-renewable, and because in a Carbon Economy the overall nuclear cycle (excluding the actual nuclear fission) generates large amounts of CO2.
(B5). Fugitive Emissions from energy-related activities are re-assessed as a huge 20.1 Gt CO2-e in 2018 and are increasing at 5.2% pa.
Current wrong way. There is massive under-estimation of fugitive emissions of methane (CH4) from coal mines, gas extraction sites and the gas distribution systems. Thus energy-related Fugitive Emissions in 2013 were estimated by the IEA as 0.052 x 48.3 Gt CO2-e = 2.51 Gt CO2-e [1] whereas GHG emissions from fugitive emission in the energy sector were calculated in B1 above as 8.75 Gt CO2-e in 2013 (4.2 times greater than the IEA estimate) and 10.1 Gt CO2-e (2018). Fugitive Emissions are directly proportional to gas production and hence the 5.2% pa increase in natural gas production is associated with a 5.2% pa increase in Fugitive Emissions.
As a check on this result, consider a separate set of data from DNV-GL on Liquid Natural Gas (LNG) alone (2018): “DNV GL forecasts global LNG production will increase from 250 million tonnes per year in 2016 to around 630 million tonnes per year by 2050” [+11.2% pa]” [63]. Combustion of 1 tonne of CH4 (85% of natural gas) yields 2.75 tonne CO2. Thus CO2 emissions from burning annual gas production of 250 Mt gas = 250 Mt gas x 2.75 t CO2/t CH4 = 687.5 Mt CO2. Assuming a GWP for CH4 of 105, at 2.6% CH4 leakage the greenhouse effect of the leaked CH4 is the same as the greenhouse effect from burning the remaining 97.4% of the gas [41, 42]. Accordingly the overall GHG effect with a 2.6% gas leakage from LNG production is 0.974 x 687.5 Mt CO2 = 670 Mt CO2-e = 0.67 Gt CO2-e pa (indeed this may be under-estimated because gas leakage in the US is estimated at 5.4% [44-46]).
Required actions. There must be rapid cessation of gas exploitation. Because gas leaks and the GWP for CH4 is 105 relative to that of the same mass of CO2 on a 20 year time frame with aerosol impacts considered, at 2.6% leakage the Fugitive Emissions from natural gas exploitation have roughly the same greenhouse gas effect as the CO2 from burning the residual gas. Indeed in typical circumstances using gas is worse GHG-wise that using coal and hence a “coal-to-gas transition” is a dangerous absurdity.
Final comments.
Eminent physicist and cosmologist Professor Stephen Hawking (of 120 Nobel laureate University of Cambridge) has commented succinctly on the existential threats to Humanity posed by nuclear weapons and global warming: “We see great peril if governments and societies do not take action now to render nuclear weapons obsolete and to prevent further climate change” [64]. The operative word here is “now”.
Scientists warn that “net zero emissions by 2050” is required to keep under a catastrophic +2C of global warming. However, for example, the anti-science, anti-environment, climate criminal and Trumpist Australian Coalition Government has attacked the Labor Opposition for adopting this goal [65]. The science-informed and humanitarian Australian Greens state that: “A safe climate will require a return to an atmospheric concentration of 350 parts per million or lower of greenhouse gases (and CO2 equivalents)… Net zero or net negative Australian greenhouse gas emissions by no later than 2040” [66].
As set out in this detailed analysis, global greenhouse gas (GHG) emissions in all key economic sectors of energy production and non-energy production are increasing whereas the worsening Climate Emergency demands urgently decreasing GHG emissions and ultimately net zero GHG emissions ASAP. All that sane, science-informed people can do is to endlessly re-state “Wrong Way Go Back”.
References.
[1]. Center for Climate and Energy Solutions, “Global emissions”, 2017: https://www.c2es.org/content/international-emissions/ .
[2]. New Zealand Government, “Global greenhouse gas emissions”, http://archive.stats.govt.nz/browse_for_stats/environment/environmental-reporting-series/environmental-indicators/Home/Atmosphere-and-climate/global-greenhouse-gases.aspx .
[3]. Alison Benjamin, “Stern: climate change a “market failure””, Guardian, 29 November 2007: https://www.theguardian.com/environment/2007/nov/29/climatechange.carbonemissions .
[4]. Pope Francis , Encyclical Letter “Laudato si’”, 2015: http://w2.vatican.va/content/francesco/en/encyclicals/documents/papa-francesco_20150524_enciclica-laudato-si.html .
[5]. Gideon Polya, “ Green Left Pope Francis Demands Climate Action “Without Delay” To Prevent Climate “Catastrophe””, Countercurrents, 10 August, 2015: https://countercurrents.org/polya100815.htm .
[6]. Chris Hope, “How high should climate change taxes be?”, Working Paper Series, Judge Business School, University of Cambridge, 9, 2011: http://www.jbs.cam.ac.uk/media/assets/wp1109.pdf .
[7]. James Hansen, “Climate change in a nutshell: the gathering storm”, Columbia University, 18 December 2018: http://www.columbia.edu/~jeh1/mailings/2018/20181206_Nutshell.pdf .
[8]. Allied Market Research, “Bunker Fuel Market”, January 2019: https://www.alliedmarketresearch.com/bunker-fuel-market .
[9]. “Landfill gas”, Wikipedia: https://en.wikipedia.org/wiki/Landfill_gas .
[10]. Drew T. Shindell , Greg Faluvegi, Dorothy M. Koch , Gavin A. Schmidt , Nadine Unger and Susanne E. Bauer , “Improved Attribution of Climate Forcing to Emissions”, Science, 30 October 2009:
Vol. 326 no. 5953 pp. 716-718: http://www.sciencemag.org/content/326/5953/716 .
[11]. Global Methane Initiative, “Landfill methane: reducing emissions, advancing recovery and use opportunities”, September 2011: https://www.globalmethane.org/documents/landfill_fs_eng.pdf .
[12]. Waste Management Research editorial, “Landfilling in developing countries”, Waste Management Research, 31(1) 1–2, 2013: https://journals.sagepub.com/doi/pdf/10.1177/0734242X12469169 .
[13]. Erica Gies, “Landfills have a huge greenhouse gas problem. Here’s what we can do about it ”, ENSIA, 25 October 2016: https://ensia.com/features/methane-landfills/ .
[14]. Aleksandra Arcipowska, Emily Mangan, You Lyu and Richard Waite, “5 questions about agricultural emissions, answered ”, World Resources Institute, 29 July 2019: https://www.wri.org/blog/2019/07/5-questions-about-agricultural-emissions-answered .
[15]. William J. Ripple et al., 15,364 signatories from 184 countries, “World scientists’ warning to Humanity: a second notice”, Bioscience, 13 November 2017: https://academic.oup.com/bioscience/advance-article/doi/10.1093/biosci/bix125/4605229 .
[16]. Gideon Polya, “Over 15,000 scientists issue dire warning to humanity on catastrophic climate change and biodiversity loss”, Countercurrents, 20 November 2017: https://countercurrents.org/2017/11/20/over-15000-scientists-issue-dire-warning-to-humanity-on-catastrophic-climate-change-and-biodiversity-loss/ .
[17]. William Ripple et al.., “World scientists’ warning of a climate emergency”, BioScience, 5 November 2019: https://academic.oup.com/bioscience/advance-article/doi/10.1093/biosci/biz088/5610806 .
[18]. Gideon Polya, “Extrapolating 11,000 scientists’ climate emergency warning to 2030 catastrophe”, Countercurrents, 14 November 2019: https://countercurrents.org/2019/11/extrapolating-11000-scientists-climate-emergency-warning-to-2030-catastrophe .
[19]. Gideon Polya, “Worsening Climate Emergency And Record CO2 Emissions Demand Vegetarian Diet For All To Help Save Planet”, Countercurrents, 20 June, 2016: https://countercurrents.org/polya200616.htm .
[20]. Gideon Polya, “Biofuel famine, biofuel genocide, meat & global food price crisis”, Global avoidable mortality: http://globalavoidablemortality.blogspot.com.au/2008/05/biofuel-famine-biofuel-genocide-meat.html .
[21]. Robert Goodland and Jeff Anfang. “Livestock and climate change. What if the key actors in climate change are … cows, pigs and chickens?”, World Watch, November/December 2009: https://awellfedworld.org/wp-content/uploads/Livestock-Climate-Change-Anhang-Goodland.pdf .
[22]. “List of countries by meat consumption”, Wikipedia: https://en.wikipedia.org/wiki/List_of_countries_by_meat_consumption .
[23]. Gideon Polya, “Trumpist climate change denials Australian bushfires, fuel reduction, biochar & Carbon Debt”, Countercurrents, 10 January 2020: https://countercurrents.org/2020/01/trumpist-climate-change-denial-australian-bushfires-fuel-reduction-biochar-carbon-debt .
[24]. H. Keith, B.G. Mackey and D. B. Lindenmayer., “Re-evaluation of forest biomass carbon stocks and lessons from the world’s most carbon-dense forests”, PNAS, 14 July 2009, 106 (28) 11635-11640: https://www.pnas.org/content/106/28/11635 .
[25]. Hubau, W., Lewis, S.L., Phillips, O.L. et al. Asynchronous carbon sink saturation in African and Amazonian tropical forests. Nature 579, 80–87, 2020, https://doi.org/10.1038/s41586-020-2035-0 .
[26]. Baccini et al., 2017, “Tropical forests are a net carbon source based on aboveground measurements of gain and loss”, Science, http://science.sciencemag.org/content/early/2017/09/27/science.aam5962 .
[27]. “Tropical forests are now carbon source, not carbon sinks”, Countercurrents, 5 March 2020: https://countercurrents.org/2020/03/tropical-forests-are-now-carbon-source-not-carbon-sinks .
[28]. Phillip Levin and Donald Levin, “The real biodiversity crisis”, American Scientist, January-February 2002: http://www.americanscientist.org/issues/pub/the-real-biodiversity-crisis .
[29]. Gideon Polya, “How much negative carbon emissions, negative population growth & negative economic growth is needed to save Planet?” Countercurrents, 28 November 2019: https://countercurrents.org/2018/11/how-much-negative-carbon-emissions-negative-population-growth-negative-economic-growth-is-needed-to-save-planet .
[30]. World Steel Association, “Global steel output increases by 3.4% in 2019”, 27 January 2020: https://www.worldsteel.org/media-centre/press-releases/2020/Global-crude-steel-output-increases-by-3.4–in-2019.html .
[31]. M. Kundak, L. Lazic, and J. Crnko, “CO2 emissions in the steel industry”, Metabk, 48 (3), 193-197, 2009: file:///C:/Users/Gideon/AppData/Local/Temp/MET_48_3_193_197_Kundak-2.pdf .
[32]. “Portland cement”, Wikipedia: https://en.wikipedia.org/wiki/Portland_cement .
[33]. Yyxia (Sarah) Zhang, Khin Soe, and Yingying Guo, “Green cement a step closer to being a game-changer for construction emissions”, The Conversation, 19 November 2019: https://theconversation.com/green-cement-a-step-closer-to-being-a-game-changer-for-construction-emissions-126033 .
[34]. Statista, “Cement production globally and in the U.S. from 2010 to 2019”, 2019: https://www.statista.com/statistics/219343/cement-production-worldwide/ .
[35]. Michael Mazengarb, “Nordic steel giant to use renewable hydrogen to produce fossil- free steel by 2026”, Renew Economy, 30 January 2020: https://reneweconomy.com.au/nordic-steel-giant-to-use-renewable-hydrogen-to-produce-fossil-free-steel-by-2026-2026/ .
[36]. IAE, “Global energy and CO2 status report 2019”: https://www.iea.org/reports/global-energy-co2-status-report-2019/emissions .
[37]. IEA, “Tracking power: coal power”, May 2019: https://www.iea.org/reports/tracking-power-2019/coal-fired-power .
[38]. IEA, “Coal”, 2019: https://www.iea.org/fuels-and-technologies/coal .
[39]. IEA, “Gas”, 2019: https://www.iea.org/fuels-and-technologies/gas .
[40]. IEA, “Oil”, 2019: https://www.iea.org/fuels-and-technologies/oil .
[41]. “Gas is dirty energy”: https://sites.google.com/site/gasisnotcleanenergy/gas-is-dirty-energy .
[42]. “Gas is not clean energy”: https://sites.google.com/site/gasisnotcleanenergy/home .
[43]. “BP statistical review of world energy 2019”: https://www.bp.com/content/dam/bp/business-sites/en/global/corporate/pdfs/energy-economics/statistical-review/bp-stats-review-2019-full-report.pdf
[44]. Robert Howarth, “Methane emissions and climatic warming risk from hydraulic fracturing and shale gas development: implications for policy”, Energy & Emission Control Technologies, 8 October 2015: https://www.eeb.cornell.edu/howarth/publications/f_EECT-61539-perspectives-on-air-emissions-of-methane-and-climatic-warmin_100815_27470.pdf .
[45]. “Gas leakage – systemic gas leakage in the US is about 5.8%”, Gas is not clean energy: https://sites.google.com/site/gasisnotcleanenergy/gas-leakage .
[46]. Gideon Polya, “Rampant Orwellian falsehood in neoliberal Australia – and in your country too?”, Countercurrents, 1 March 2020: https://countercurrents.org/2020/03/rampant-orwellian-falsehood-in-neoliberal-australia-and-in-your-country-too .
[47]. Deloitte, “The global truck market is optimistic”, Truck Market 2024: https://www2.deloitte.com/content/dam/Deloitte/tr/Documents/process-and-operations/truck-studie-2014-s.pdf .
[48]. IBISWorld, “Global car & automobile industry – market research report”, November 2019: https://www.ibisworld.com/global/market-research-reports/global-car-automobile-sales-industry/ .
[49]. IEA, “The future of rail”, 2019: https://www.iea.org/reports/the-future-of-rail .
[50]. “Manufacturing the future: The next era of global growth and innovation”, Executive Summary, November 2012: https://www.mckinsey.com/~/media/McKinsey/Business%20Functions/Operations/Our%20Insights/The%20future%20of%20manufacturing/MGI_Manufacturing%20the%20future_Executive%20summary_Nov%202012.ashx
[51]. PwC, “Global construction 2030: A global forecast for the construction industry to 2030”: https://www.pwc.com/vn/en/industries/engineering-and-construction/pwc-global-construction-2030.html .
[52]. Irene Banos Ruiz , “China’s new love affair with dogs – as pets, not food – presents environmental problems”, DW, 21 June 2016: https://www.dw.com/en/chinas-new-love-affair-with-dogs-as-pets-not-food-presents-environmental-problems/a-19197523 .
[53]. Jason Daley, “The EPA declared that burning wood is carbon neutral. It’s actually a lot more complicated ” Smithsonian Magazine Smart News, 24 April , 2018: https://www.smithsonianmag.com/smart-news/epa-declares-burning-wood-carbon-neutral-180968880/ .
[54]. World Bioenergy Association, “Global biomass potential towards 2035”, March 2016: https://worldbioenergy.org/uploads/Factsheet_Biomass%20potential.pdf .
[55]. World Bioenergy Association, “Global bioenergy statistics 2019”: https://worldbioenergy.org/uploads/191129%20WBA%20GBS%202019_LQ.pdf .
[56]. Statista, “Global biofuel production from 2000 to 2018”: https://www.statista.com/statistics/274163/global-biofuel-production-in-oil-equivalent/ .
[57]. “Biofuel Genocide”: https://sites.google.com/site/biofuelgenocide/home .
[58]. Timothy Searchinger et al, “Use of U.S. Croplands for Biofuels Increases Greenhouse Gases Through Emissions from Land-Use Change”, Science 29 February 2008, Vol. 319. no. 5867, pp. 1238 – 1240: http://www.sciencemag.org/cgi/content/abstract/1151861 .
[59]. Joseph Fargione et al, “Land Clearing and the Biofuel Carbon Debt” , Science 29 February 2008, Vol. 319. no. 5867, pp. 1235 – 1238: http://www.sciencemag.org/cgi/content/abstract/1152747 .
[60]. Gideon Polya, “Exposing The Greenwash Falsehood Of “Renewable Ethanol””, Countercurrents, 19 April, 2014: https://www.countercurrents.org/polya190414.htm .
[61]. Gideon Polya, “Rampant Orwellian falsehood in neoliberal Australia – and in your country too?”, Countercurrents, 1 March 2020: https://countercurrents.org/2020/03/rampant-orwellian-falsehood-in-neoliberal-australia-and-in-your-country-too .
[62]. Gideon Polya, “Methane leakage makes Australia a world leading per capita greenhouse gas polluter”, Countercurrents, 18 February 2020: https://countercurrents.org/2020/02/methane-leakage-makes-australia-a-world-leading-per-capita-greenhouse-gas-polluter .
[63]. Steel Guru, “DNV-GL forecasts global LNG production to increase to around 630 million tonnes by 2050”, Gasoil News, 5 April 2019: https://steelguru.com/gas-oil/dnv-gl-forecasts-global-lng-production-to-increase-to-around-630-million-tonne-by-2050/537692 .
[64]. Stephen Hawking, “Brief Answers to the Big Questions”, John Murray, 2018, Chapter 7.
[65]. Mike Foley, “Australia must hit net zero by 2050 to meet Paris: scientist”, Sydney Morning Herald, 24 February 2020: https://www.smh.com.au/politics/federal/australia-must-hit-net-zero-by-2050-to-meet-paris-scientists-20200224-p543ss.html .
[66]. The Greens, “Climate change and energy”, November 2018: https://greens.org.au/policies/climate-change-and-energy .
Dr Gideon Polya taught science students at a major Australian university for 4 decades. He published some 130 works in a 5 decade scientific career, most recently a huge pharmacological reference text “Biochemical Targets of Plant Bioactive Compounds” (CRC Press/Taylor & Francis, New York & London , 2003). He has published “Body Count. Global avoidable mortality since 1950” (G.M. Polya, Melbourne, 2007: http://globalbodycount.blogspot.com/ ); see also his contributions “Australian complicity in Iraq mass mortality” in “Lies, Deep Fries & Statistics” (edited by Robyn Williams, ABC Books, Sydney, 2007: http://www.abc.net.au/radionational/programs/ockhamsrazor/australian-complicity-in-iraq-mass-mortality/3369002#transcript ) and “Ongoing Palestinian Genocide” in “The Plight of the Palestinians (edited by William Cook, Palgrave Macmillan, London, 2010: https://countercurrents.org/polya170612.htm ). He has published a revised and updated 2008 version of his 1998 book “Jane Austen and the Black Hole of British History” (see: http://janeaustenand.blogspot.com/ ) as biofuel-, globalization- and climate-driven global food price increases threaten a greater famine catastrophe than the man-made famine in British-ruled India that killed 6-7 million Indians in the “forgotten” World War 2 Bengal Famine (see recent BBC broadcast involving Dr Polya, Economics Nobel Laureate Professor Amartya Sen and others: http://www.open.edu/openlearn/history-the-arts/history/social-economic-history/listen-the-bengal-famine ; Gideon Polya: https://sites.google.com/site/drgideonpolya/home ; Gideon Polya Writing: https://sites.google.com/site/gideonpolyawriting/ ; Gideon Polya, Wikipedia: https://en.wikipedia.org/wiki/Gideon_Polya ) . When words fail one can say it in pictures – for images of Gideon Polya’s huge paintings for the Planet, Peace, Mother and Child see: http://sites.google.com/site/artforpeaceplanetmotherchild/ and http://www.flickr.com/photos/gideonpolya/ .
SIGN UP FOR COUNTERCURRENTS DAILY NEWS LETTER