As shown in our previous articles on Budget 2024-25, the Indian economy is
facing a severe unemployment crisis and a huge increase in poverty. All this requires that the government should greatly increase its spending on the people. This article examines the efforts made by the Modi Government to increase its budget outlay
We have shown in considerable detail in our previous articles on the economic situation in the country that the Indian economy is in deep crisis. The actual growth rate of the economy is much less than is being projected by the Modi Government.[1] There is massive unemployment in the country; we estimate that more than half the people of working age are unemployed.[2] There is acute distress; probably around 70% of the population is mired in poverty.[3] India is facing a hunger emergency. According to the latest report by the FAO (in association with four other UN agencies) on the prevalence of moderate or severe food insecurity around the world, more than 30% of the country’s population is severely food insecure, and as many as 55.6% of the people are unable to afford a healthy diet.[4] Within the framework of welfare capitalism, the most effective solution to these terrible crises is that the government should greatly increase its spending on the people, by making a huge increase in its budget outlay.
An analysis of the components of the GDP also points to the same conclusion.
GDP in any economy equals: Private Final Consumption Expenditure (or PFCE, which is a proxy for household consumption) + Gross Fixed Capital Formation (or GFCF, which is a measure of total private investment) + Government Final Consumption Expenditure or GFCE (government spending on providing services and goods directly for the country). (In this, we are ignoring net exports and some other components as they are a relatively minor factor.) We present these various components of the GDP in Table 1.
Table 1: GDP and its Components, 2022–23 to 2023–24 (Rs cr)[5]
| 2022–23 (FRE) (2) | 2023–24 (PE) (1) | Growth rate (1 over 2), % | |
| GDP at Constant Prices (at 2011–12 prices) | 1,60,71,429 | 1,73,81,722 | 8.2 |
| Private Final Consumption Expenditure (PFCE) | 93,23,825 | 96,99,214 (55.8%) | 4 |
| Govt Final Consumption Expenditure (GFCE) | 16,13,726 | 16,53,333 (9.5%) | 2.5 |
| Gross Fixed Capital Formation (GFCF) | 53,46,423 | 58,26,880 (33.5%) | 9 |
Figures in brackets = Share in GDP;
PE=Provisional Estimates; FRE= First Revised Estimates
Table 1 shows that the 8.2% GDP growth rate clocked in 2023–24 is mainly due to a large increase in private investment (that is, GFCF), which has gone up by 9% over the previous year. On the other hand, while private consumption (PFCE) is the biggest component of India’s economy, accounting for 56% of the GDP in 2023–24, Table 2 shows that growth rate of private consumption has consistently fallen during the post-pandemic period from 11.7% in 2021–22 to 6.8% in 2022–23 and to a lowly 4% in 2023–24. But private investment depends upon growth of demand. This only means that the increase in GFCF observed in 2023–24 is not sustainable, unless PFCE picks up in the coming years.
Table 2: Private Consumption: Percentage Change over Previous Year [6]
| 2020–21 (3rd RE) | 2021–22 (2nd RE) | 2022–23 (1st RE) | 2023–24 (PE) | |
| PFCE: % change over previous year (at constant prices) | –5.3 | 11.7 | 6.8 | 4 |
PE=Provisional Estimates; RE = Revised Estimates
{Actually, growth in PFCE has been slowing down ever since the Modi Government assumed power in 2014 (even if we exclude the pandemic year of 2020–21) — it was an average of 7.5% during the triennium FY15 to FY17, and 6.2% during the triennium FY18 to FY20.[7] Such a long stretch of consumption slowdown has not been observed in the last two decades.[8]}
The growth rate of private consumption is the average for both the poor and the rich. Because of the sharp rise in inequality during the Modi years and the huge increase in poverty levels in the country, it is very likely that the small increase in private consumption in 2023–24 only reflects the rising consumption of the rich; the consumption of the poor may even be in decline. Even mainstream political analysts have characterised India’s economic recovery during the post-pandemic period as ‘K-shaped’: led by the upper class, with growth in demand for premium goods outstripping that for the mass-market segment.[9]
The increasing economic distress being faced by the majority of the people during the past decade can also be observed in data put out by the RBI Annual Report of 2024. It shows that net household savings have fallen to a record low of 5.2% of the gross national disposable income (GNDI) in 2022–23, from 7.9% in 2015–16.[10] A report in the Economic Times in fact points out that net financial savings of households as a percentage of GDP in FY23 had fallen to a five-decade low of 5.3%.[11] This means that people are drawing down on savings to fund consumption — an indication of falling incomes and rising distress.
Therefore, for the economy to have a sustained recovery, it is important that the government greatly increases its expenditure. So far as the ordinary people are concerned, even if this does take place, they will only benefit from it if the government increases its spending in such a way that it leads to an increase in domestic consumption and puts purchasing power in the hands of the people. That would lead to an increase in domestic demand, and fuel an increase in private investment.
But before we begin our analysis of Budget 2024, let us take a look at the state of the Modi Government’s revenues over the past decade, and the scope for increasing them.
State of Modi Government’s Revenues: 2014–15 to 2023–24
i) Low Government Tax Revenues
In every capitalist country in the world, especially the developed capitalist countries, while their governments essentially run the economy for the profiteering of the rich, they also collect significant amount of taxes from them and spend it on providing education, healthcare and other welfare services for their people. The average tax revenues of the governments of the developed countries (the 38 countries of the OECD) as a percentage of their GDP (this is called the tax-to-GDP ratio) was 34% in 2022.[12] The tax-to-GDP ratio of India’s Emerging Market peers like Brazil, Argentina and South Africa was 33.5%, 29.1% and 27% respectively in 2021 — only slightly lower than that of the developed countries.[13]
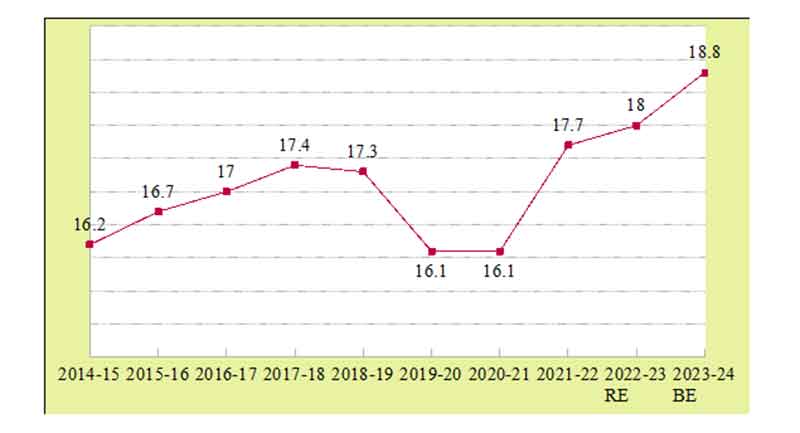
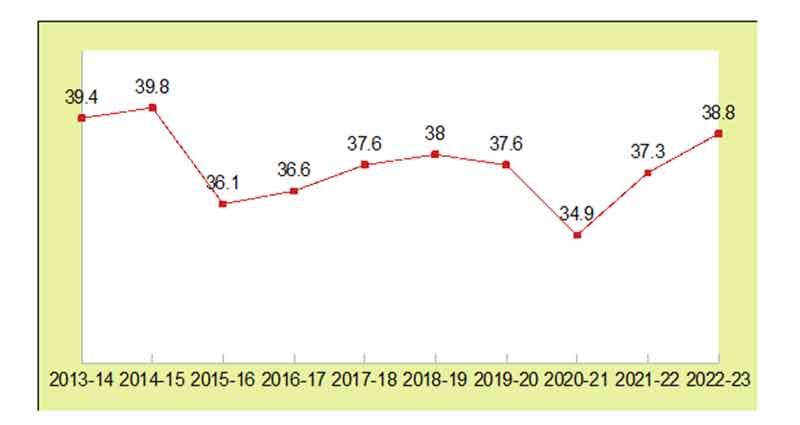
In contrast, India’s tax-to-GDP ratio (including taxes of both Centre and States) has fluctuated between 16 and 17% during the past decade and increased to 18.8% in 2023–24 BE (Chart 1).
Chart 1: India Tax-to-GDP Ratio, 2014–15 to 2023–24 (in %) [14]
ii) Falling Direct Taxes, Rising Indirect Taxes
Government’s tax revenues have two components, direct taxes and indirect taxes. Direct taxes are levied on incomes, such as wages, profits, property, etc., and so fall directly on the rich; while indirect taxes are imposed on goods and impersonal services, and so fall on all, both rich and poor. An equitable system of taxation taxes individuals and corporations according to their ability to pay, which in practice means that in such a system the government collects its tax revenues more from direct taxes than indirect taxes. The developed countries collect the bulk of their tax revenues from the rich, that is, through direct taxes. The ratio of direct taxes to total tax revenue is 76.6% for USA, 67% for Japan, 61.8% for South Korea, 57.1% for Germany, 59.6% for UK, 74.5% for Australia, and 72.7% for Canada.[15] The Economic Survey 2017–18 of the Government of India too mentions that direct taxes account on average for about 70% of total taxes in Europe.[16]
In India, as it is, the total tax revenues are low. Within these low tax revenues, the Centre has been giving huge concessions in direct taxes paid by the rich. First, the Modi government did away with the wealth tax in 2016; admittedly it was not fetching much revenue even then, but doing away with it was a signal. Then, in 2019 the government reduced the base corporate tax rate for then existing companies from 30% to 22%, and for new manufacturing firms, incorporated after October 1, 2019, to 15% from 25%. A press note released by the government stated that the estimated revenue loss due to the corporate tax cut would be Rs 1.45 crore per year.[17]
One consequence of these corporate tax concessions is that since FY 2020–21, income taxes have contributed more to the gross tax revenues than corporate taxes (except 2021–22) (see Chart 2). In 2023–24 RE, while corporate tax collections totalled Rs 9.23 lakh crore, income tax collections were significantly higher at Rs 10.22 lakh crore. Consequently, while in 2014–15 Actuals, corporate tax collections constituted 34.5% of the gross tax revenues of the Center, and income tax collections contributed less at 21.3%, in the 2023–24 revised estimates, this proportion had got reversed — income tax collections now constituted 29.7% of the gross tax collections, while contribution of corporate taxes was lower at 26.8% (see Chart 2). This means that the middle classes are now contributing more to Central Government’s tax collections as compared to corporate houses.
Chart 2: Trend of Corporate Tax and Income Tax Revenues, 2014–15 to 2023–24
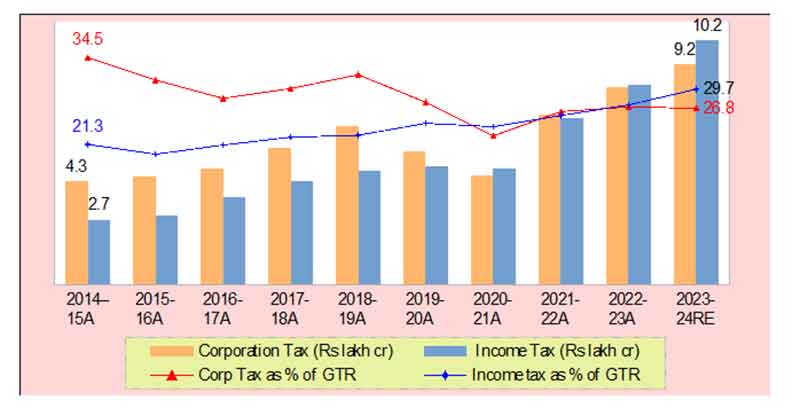
GTR: Gross tax revenues
To compensate for this revenue loss, the Modi Government has hugely increased indirect taxes:
- it has imposed GST on even essential commodities of daily consumption, like pre-packed and labelled wheat, rice, pulses and other foodgrains, several milk products like curd and paneer, fish and meat, several stationery items like pencil sharpeners and ink, and so on;
- it has hiked excise duty (including cesses) on petrol and diesel — in fact, by 2020, it had increased the excise on petrol by more than 3 times, and that on diesel by 9 times, before reducing it to their present level due to electoral compulsions (see Table 3).
Table 3: Excise Duty on Petrol and Diesel, 2014 to 2023 (Rs / litre)[18]
| May 2014 | May 2020 | January 2024 | |
| Excise Duty on Petrol | 9.48 | 32.98 | 19.90 |
| Excise Duty on Diesel | 3.56 | 31.83 | 15.80 |
The total income of the Union Government from both these heads is given in Table 4.
Table 4: Centre’s Revenue from Petrol–Diesel Taxes and GST,
2014–15 to 2023–24 (Rs lakh crore)[19]
| 2014–15 to 2023–24 | |
| Income from Taxes and Duties on Crude Oil and Petroleum Products | 30.24 |
| 2017–18 to 2023–24 | |
| Income from GST | 31.20 |
| Total | 61.44 |
The total income of the Centre from GST since the government introduced it in 2017–18 till 2023–24 (RE) was Rs 31.20 lakh crore. And the total income of the Central Government from taxes and duties on crude oil and petroleum products from 2014–15 to 2023–24 (RE) was Rs 30.24 lakh crore.[20]
The total income of the Centre from these two indirect taxes during the past ten 10 years of Modi rule [2014–15 to 2023–24 (RE)] totals Rs 61.44 lakh crore (see Table 4). These two indirect taxes together contributed more than one-third (37.9%) of the total Gross Tax Revenues of the Central Government over these 10 years![21]
The consequence of the direct tax concessions on one hand, and massive hike in indirect taxes on the other, is that in India, for every Rs 100 collected by the General government (Centre + States combined) as tax revenue, only around Rs 37 comes from direct taxes, and the rest, ~Rs 63, from indirect taxes (see Chart 3).
Chart 3: Direct Taxes as % of Total Tax Revenues (Centre and States combined) [22]
The burden of paying indirect taxes falls disproportionately on the poor, both individually as well as collectively. At the individual level, a poor person pays a larger portion of his/her income as indirect taxes as compared to the rich. And collectively too, the bulk of the indirect taxes collected by the government come from the poor. A 2023 Oxfam report on growing inequality in India estimates that the bottom 50% of the population pays six times more on indirect taxes as a percentage of income compared to the top 10%. And of the total GST collected from food and non-food items, 64.3% comes from the bottom 50%, one-third from middle 40% and a meagre 3–4% come from the top 10%.[23]
It is this huge rise in indirect taxes that is responsible for the steep rise in inflation over the past few years. And it is the poor who are the worst sufferers of rising inflation. So, they are double hit.
iii) Low General Government Total Revenues
Of the total revenues of all kinds collected by the Centre and States, including Centre’s borrowings, the Centre collects roughly 70%, and the States’ own revenue is 30%.[24] Furthermore, while the Centre has great flexibility in raising resources if it wishes to do so, the States have few independent sources of revenue and limited access to emergency borrowings. Therefore, the main responsibility for raising budgetary revenues of the general government (that is, Centre and State governments) lies with the Central government.
In India, the Modi Government has not only been giving huge tax concessions to the big corporate houses, it has also been transferring huge amounts of public funds into the coffers of the rich, through means like loan write-offs, subsidies given in the name of PPPs, ‘strategic disinvestment’ in public sector corporations, transfer of mineral wealth to private corporations for negligible royalty payments, and so on (we discuss this in detail in a later article). Because of all these concessions and subsidies, not only is the total revenue of the Central government low, the general government revenue (that is, revenue of Centre and States combined) is also low. This is borne out by a comparison with the general government revenues of other countries. India’s total general government revenue as percentage of GDP is among the lowest in the world.
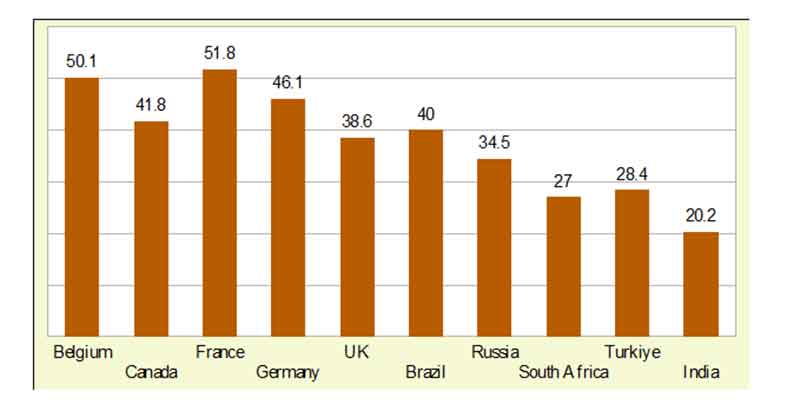
According to the IMF Fiscal Monitor, in 2023, the general government revenue as a percentage of GDP for the 19 Euro area countries was 46.4%. For the Middle Income Economies of Europe, it averaged 34.6% of GDP, and for Emerging Market Economies of Latin America it was 30.2%. But total general revenue of the Government of India (Centre + States combined) was much lower — just 20.2% of GDP (see Chart 4).
Chart 4: General Government Revenues as % of GDP:
Developed Countries & Emerging Market Economies vs. India, 2023 [25]
With this background, let us examine whether it is possible for the Modi Government to raise its revenues.
Budget 2024–25: Huge Scope for Increasing Revenues
i) By Imposition of Wealth Tax and Inheritance Tax on Super-Rich
As discussed above, the total tax revenues of the Government of India (Centre + States) are very low: India’s tax-to-GDP ratio is just around 16–17% (it has increased to 18.8% in 2023–24 BE), while it is around 34% for the developed countries, and ranges between 27–33% for India’s Emerging Market peers like Brazil and South Africa.
Let us assume that the Indian government decides to increase the country’s tax-to-GDP ratio to 25% and bring it to near that for the Emerging Market economies (it would still be 9 percentage points below that of the developed countries). For this, the Centre’s gross tax revenues would need to increase by Rs 22.85 lakh crore — they would need to go up from Rs 38.4 lakh crore in 2024–25 BE to Rs 61.25 lakh crore.[26] (Note that we are assuming here that the responsibility for increasing taxes lies entirely with the Centre — as it has more flexibility in increasing tax revenues.)
This is not an outlandish proposal; it is eminently possible. The Modi Government’s economic policies over the past decade have led to a huge concentration of wealth among the richest 1% and 0/1% people in the country. A study by a team of economists led by Nitin Bharti, Thomas Piketty and Lucas Chancel at the World Inequality Lab in Paris reveals that inequality in India has been rising due to gradual implementation of neoliberal policies since the 1990s. The acceleration of these policies during the Modi years has resulted in such a steep rise in inequality that India has today become among the most unequal countries in the world.[27]
We give two tables from the above study to give a sense of how skewed the income distribution has become in the country. Table 5 presents a summary of the income inequality in India in 2022–23. The visualisation of the same data in Chart 5 brings out the inequality more starkly.
Table 5: Income Inequality in India [28]
| Income Group | Adults | Income Share (%) | Average Income (Rs) | Ratio to Average |
| Average | 92,23,44,832 | 100 | 2,34,551 | 1.0 |
| Bottom 50% | 46,11,72,416 | 15.0 | 71,163 | 0.3 |
| Middle 40% | 36,89,37,933 | 27.3 | 165,273 | 0.7 |
| Top 10% | 9,22,34,483 | 57.7 | 13,52,985 | 5.8 |
| incl. Top 1% | 92,23,448 | 22.6 | 53,00,549 | 22.6 |
| incl. Top 0.1% | 9,22,345 | 9.6 | 2,24,58,442 | 95.8 |
| incl. Top 0.01% | 92,234 | 4.3 | 10,18,14,669 | 434.1 |
| incl. Top 0.001% | 9,223 | 2.1 | 48,51,96,875 | 2,068.6 |
Chart 5: Income Inequality in India
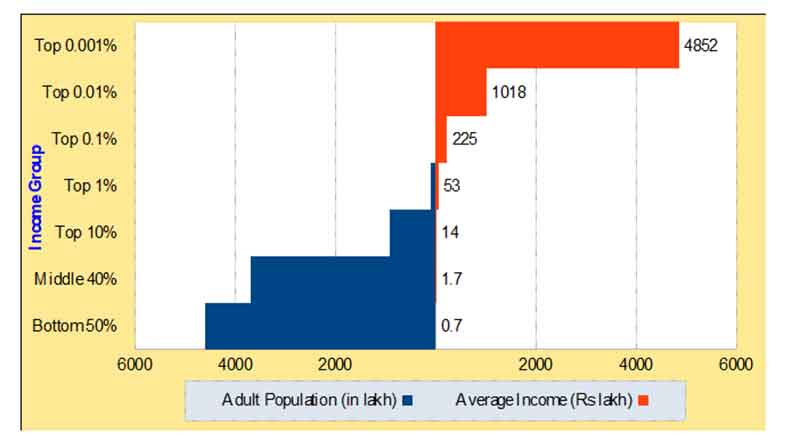
The study finds that while the bottom 50% have an average income of Rs 71,163 per year (which works out to less than Rs 6,000 per month), the top 0.1% comprising 9.2 lakh adults have an average income of Rs 2.2 crore per annum, and the top 0.001% comprising of just 9,200 adults have an average annual income of Rs 48.5 crore.
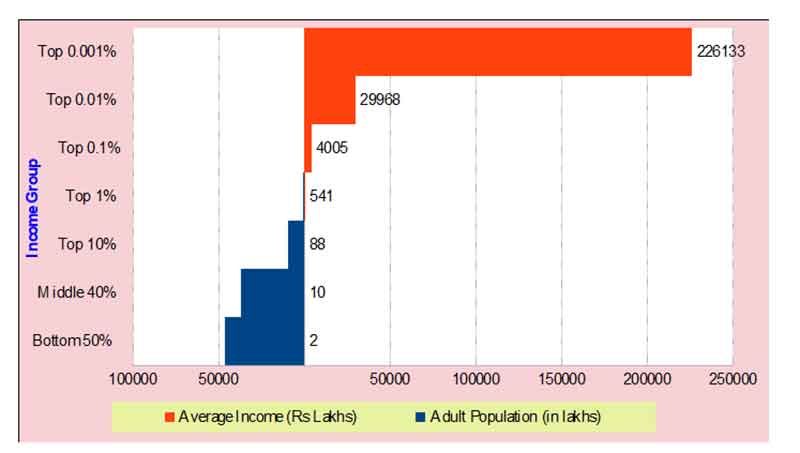
Table 6 presents a summary of the wealth inequality in India, and Chart 6 presents its visualisation. The wealth inequality is even more extreme. A significant share of adults own close to no wealth at all. The bottom 50% of the population owns only 6.4% of the total wealth. On the other hand, there is extreme wealth concentration at the very top. The top 1% own 40% of the total wealth in the country, and have an average wealth of Rs 5.4 crore. The top 0.1% hold 30%, and have an average wealth of Rs 40 crore. While just 9,200 adults — the richest 0.001% — control a whopping 17% of the total wealth in the country, and their average net wealth exceeds Rs 2,200 crore!
Table 6: Wealth Inequality in India [29]
| Wealth group | Adults | Wealth Share (%) | Average Wealth (Rs) | Ratio to Average |
| Average | 92,23,44,832 | 100 | 13,49,029 | 1 |
| Bottom 50% | 46,11,72,416 | 6.4 | 1,73,184 | 0.1 |
| Middle 40% | 36,89,37,933 | 28.6 | 9,63,560 | 0.7 |
| Top 10% | 9,22,34,483 | 65.0 | 87,70,132 | 6.5 |
| incl. Top 1% | 92,23,448 | 40.1 | 5,41,41,525 | 40.1 |
| incl. Top 0.1% | 9,22,345 | 29.7 | 40,04,54,807 | 296.8 |
| incl. Top 0.01% | 92,234 | 22.2 | 2,99,67,73,491 | 2,221.4 |
| incl. Top 0.001% | 9,223 | 16.8 | 22,61,33,54,928 | 16,762.7 |
Chart 6: Wealth Inequality in India
The authors of this report point out that even these figures of extreme income and wealth concentration are only conservative estimates:
[O]ur benchmark estimates are plausibly conservative in the sense that we might be underestimating the true extent of income and wealth concentration in recent years.
For instance, we are unable to account for offshore wealth when estimating the wealth distribution. We know, however, that over 1% of India’s GDP worth of wealth is parked as offshore assets by Indians in Dubai alone. Further, Indians account for over 20% of all foreign-owned real estate in Dubai. These strongly indicate that we are likely under-estimating wealth at the very top of the distribution.
Considering the huge income and wealth concentration with the richest 0.01% and 0.001% adults in the country, it is obvious that the Centre can easily increase its direct tax income by imposing a small wealth tax and inheritance tax on the very rich. The authors of the above mentioned paper on inequality in India estimate that imposition of a modest wealth tax and inheritance tax would yield an annual tax revenue of 5.82% of GDP. Their proposals are presented in Table 7.
Table 7: Tax Justice Proposals for India (2022–23) [30]
| Tax proposal | Annual Revenues | Total | |
| Wealth Tax | 3% on net wealth > 10 crores | 5.46% of GDP | 5.82% of GDP |
| 5% on net wealth > 100 crores | |||
| Inheritance Tax | 33% on estates > 10 crores | 0.36% of GDP | |
| 45% on estates > 100 crores |
The annual tax revenue estimated by Bharti, Piketty and Chancel works out to Rs 15.7 lakh crore for 2022–23. The total number of individuals who would be affected is a tiny 0.04% of the total adults in the country or 3.7 lakh. Conservatively assuming that the wealth of the country’s rich is increasing by 15% per year, imposition of the above mentioned wealth tax and inheritance tax would earn the government around Rs 20 lakh crore in annual tax revenues in 2024–25. That’s huge!
ii) By Increasing Fiscal Deficit
The other way in which the FM can increase the budgetary outlay is by increasing government borrowings, that is, by increasing the fiscal deficit. That fiscal deficit is bad for the economy, and governments should not raise money for increasing welfare expenditures by indulging in deficit financing, is bunkum! This fraudulent theory is a part of the neoliberal ideology. It had been debunked long ago by John Maynard Keynes, one of the greatest economists of the 20th century. He had argued that in an economy where there is poverty and unemployment, the government can, and in fact should, expand public works and generate employment by borrowing, that is, by enlarging the fiscal deficit; such government expenditure would also stimulate private expenditure through the ‘multiplier’ effect. All developed countries, when faced with recessionary conditions, have implemented Keynesian economic principles and resorted to high levels of public spending and high fiscal deficits — such as during the 2007–09 financial recession and now during the pandemic crisis.[31]
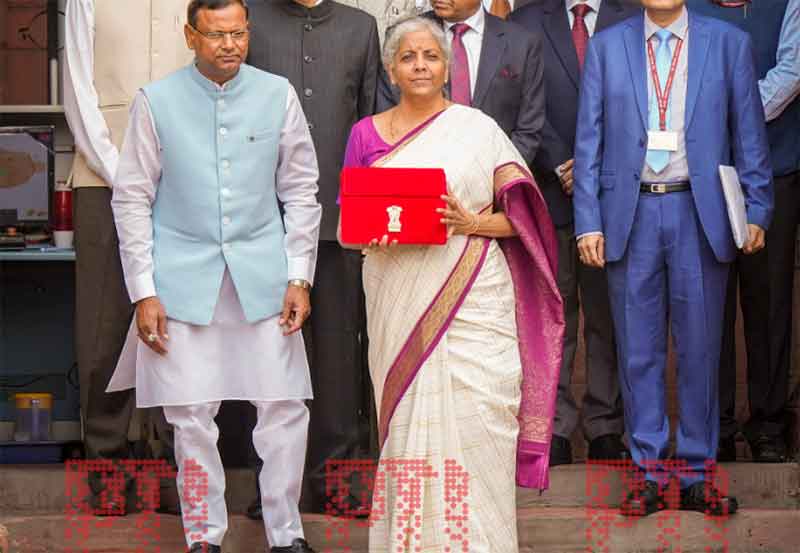
The reason why institutions like the World Bank and IMF are pushing developing countries like India to reduce their fiscal deficit is because it creates the conditions for international finance capital to enter and dominate their economies. Most importantly, in the name of reducing the fiscal deficit, the WB–IMF also force these countries to reduce their subsidies to the poor and privatise their welfare services like education and health. With India’s external debt rising, international finance capital and the WB–IMF are in a position to impose conditionalities on the Government of India.[32] And so, FM Nirmala Sitharaman is claiming that a reduction in India’s fiscal deficit would be beneficial for the economy. While presenting the interim budget on 1 February 2024, she stated in her budget speech, “We continue on the path of fiscal consolidation, as announced in my Budget Speech for 2021–22, to reduce fiscal deficit below 4.5 per cent by 2025–26. The fiscal deficit in 2024–25 is estimated to be 5.1 per cent of GDP, adhering to that path.”
The average fiscal deficit of the Central Government in the 1980s was around 7% of GDP.[33] It is only after the Government of India led by Narsimha Rao with Manmohan Singh as Finance Minister accepted the World Bank imposed Structural Adjustment Programme in 1991 that successive governments at the Centre have been harping on the necessity of reducing the fiscal deficit. Last year, that is, during the financial year 2023–24, the budget deficit was 5.9% in the budget estimates. Had the ‘nationalist’ BJP Government resisted international pressure and increased the fiscal deficit to the level of the 1980s (7% of GDP), then the budget outlay would have increased by Rs 3.3 lakh crore.[34]
Budget 2024–25: No Effort Made to Increase Revenues
i) Meagre Increase in Gross Tax Revenues
Despite their being so much scope for increasing tax revenues, the FM has announced no increase in taxes on the rich. Instead, she has reduced the corporate tax on foreign corporations to 35% from the existing 40%! She also announced some concessions for domestic and foreign investors, and minor tax concessions for the middle classes.[35] Therefore, Gross Tax Revenue in the 2024–25 budget has gone up by only 10.8% over the provisional estimate for last year (Table 8).
This is slightly greater than the estimated nominal GDP growth of 10.5% in 2024–25 (over the provisional estimates for 2023–24).
Table 8: Gross Tax Revenue, Fiscal Deficit and Budget Outlay, 2023–24 and 2024–25 (Rs cr)
| 2022–23 A | 2023–24 PE (1) | 2024–25 BE (2) | Increase, 2 over 1, % | |
| Gross Tax Revenue | 30,54,192 | 34,64,792 | 38,40,170 | 10.83% |
| Within this: | ||||
| Corporation Tax | 8,25,834 | 9,11,055 | 10,20,000 | 11.96% |
| Income Tax | 8,33,260 | 10,44,726 | 11,87,000 | 13.62% |
| GST | 8,49,133 | 9,57,032 | 10,61,899 | 10.96% |
| Fiscal Deficit | 17,37,755 (6.4%) | 16,53,670 (5.6%) | 16,13,312 (4.9%) | |
| Budget Outlay | 41,93,157 | 44,42,542 | 48,20,512 | 8.51% |
Figures in brackets are percentages of GDP
PE: Provisional Estimates
Continuing the trend of the past decade, in 2024–25 BE, income taxes contribute more to the gross tax revenues as compared to corporation tax.
Ever since the GST was introduced in 2017–18, the revenue earnings from GST have sharply increased and today exceed the earnings from corporate taxes (Chart 7).
Chart 7: Trend of Corporate Tax and GST Revenues, 2017–18 to 2024–25
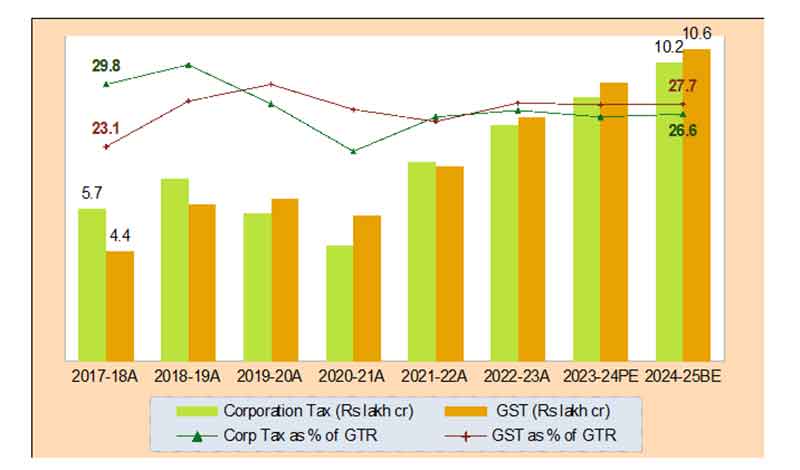
This year, the monthly GST collections have been so robust that they have become embarrassing for the government. For the quarter April–June 2024, GST revenue collections stood at Rs 5.57 lakh crore, as compared to Rs 5.05 lakh crore of Q1 last year. And so, from July this year, the Finance Ministry has discontinued releasing detailed GST collection data on day 1 of every month, a practice that had continued uninterrupted for 74 months. No reason has been given for discontinuing the release of monthly GST collection data.[36]
ii) Fiscal Deficit Further Reduced
Continuing with the trend of the past years, the Finance Minister has sought to further reduce the fiscal deficit. She proclaims in her budget speech: “The fiscal consolidation path announced by me in 2021 has served our economy very well, and we aim to reach a deficit below 4.5 per cent next year.” The Finance Minister stated that fiscal deficit for the year 2024–25 is estimated at 4.9 percent of GDP.
Budget Outlay Stagnant
With the Finance Minister not making any serious effort to increase government revenues, the budget outlay has increased by just 8.5% above last year’s provisional estimates (see Table 5). In real terms, the increase is marginal.
A better picture of how much the government has increased public investment in the economy is obtained by comparing the budget expenditure to GDP. We present that in Chart 8.
As can be seen from the Chart, the budget outlay to GDP ratio had peaked during the corona period when it increased to 17.7% in 2020–21 Actuals. Since then, it has consistently fallen and has come down to 14.8% for this year.
Chart 8: Budget Outlay as Percentage of GDP
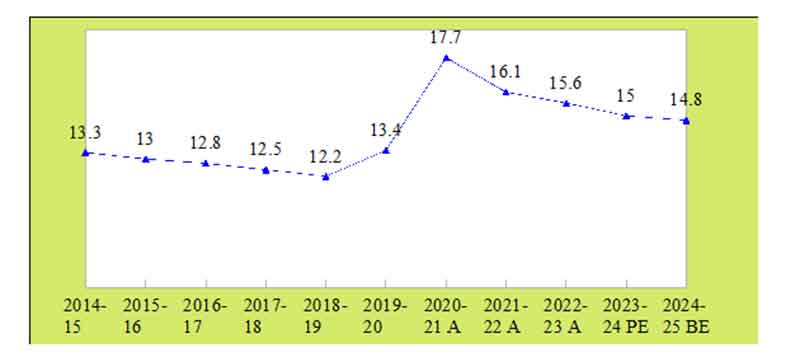
PE: Provisional Estimates
Bowing to Imperialist Dictates
The reason why the Modi Government is keeping budgetary expenditure at such low levels was outlined by FM Nirmala Sitharaman while speaking at a function organised by the Bangalore Chamber of Industry and Commerce some time ago. She said that the government’s perspective towards the Union Budget was that the government should be a facilitator and the private sector should be the key driver of economic growth.[37]
Subscribe to Our Newsletter
Get the latest CounterCurrents updates delivered straight to your inbox.
That is precisely what is desired by international finance capital. It wants the Indian government to keep its expenditures low. The Modi Government is bowing to its dictates because of India’s worsening external debt and external accounts situation, as discussed in an article written in the Janata Weekly last year.[38] Global financial capital wants the Government of India to keep its budgetary expenditure low because it creates the conditions for private capital, particularly international capital, to take control of the economy and mould it according to its desires. For all Modi talk of ‘nationalism’, in reality, the Modi Government is only meekly bowing to imperialist dictates.
Notes
1. Neeraj Jain, “Analysing Budget 2024–25 from People’s Perspective – Part 1: The GDP Claims”, 21 August 2024, https://countercurrents.org.
2. Neeraj Jain, “Analysing Budget 2024–25 from People’s Perspective: Part 2 – The Economic Survey on India’s Unemployment Crisis”, 4 September 2024, https://countercurrents.org.
3. Neeraj Jain, “Analysing Budget 2024–25 from People’s Perspective: Part 3: The Budget and Poverty”, 9 September 2024, https://countercurrents.org.
4. The State of Food Security and Nutrition in the World 2024, https://www.fao.org. Severe food insecurity data is for the triennium 2021–23, and data for percentage of population unable to afford a healthy diet is for 2022.
5. GDP figures taken from: Press Note on Provisional Estimates of Annual GDP for 2023–24 and Quarterly Estimates of GDP for Q4 of 2023–24, 31 May 2024, https://www.mospi.gov.in.
6. Data for 2023–24 taken from ibid. Data for 2020–21, 2021–22 and 2022–23 taken from: Press Note on Second Advance Estimates of National Income 2023–24 …, MoSPI, 29 February 2024, https://mospi.gov.in.
7. Calculated from data given in: Ibid.
8. “A Disconcerting Slowdown: Depressing Consumer Demand Dulls the Shine of India’s Post-Covid Domestic Market”, 12 January 2024, https://www.financialexpress.com.
9. See for instance: “Household Consumption Still Weak, But Private Sector Capex Shows Revival”, 31 May 2023, https://www.business-standard.com; “India’s K-Shaped Consumption Pattern Continues Post Pandemic””, 8 May 2024, https://www.fortuneindia.com.
10. Annual Report 2023–24, Reserve Bank of India, May 2024, p. 17, https://rbidocs.rbi.org.in.
11. “Household Savings at Five-Decade Low: A Look at Key Numbers”, 10 May 2024, https://economictimes.indiatimes.com.
12. Revenue Statistics 2023, 6 December 2023, OECD, https://www.oecd.org.
13. Global Revenue Statistics Database, OECD, https://www.oecd.org.
14. Our calculation. We have taken the data for own tax revenues of the States from the RBI publication, State Finances – A Study of Budgets, December 2023, available at https://m.rbi.org.in. For States, tax data for 2022–23 are Revised Estimates and data for 2023–24 are Budget Estimates. For Centre, gross tax revenues (Actuals) from budget papers. We have taken GDP data from National Accounts Statistics 2023; and updated it with data given in “Press Note on Second Advance Estimates of National Income 2023–24 …”, op. cit.
15. Rohit Azad and Indranil Chowdhury, “Making a Case for the Old Pension Scheme”, 18 October 2022, https://www.thehindu.com.
16. Economic Survey, 2017–18, Volume 1, Government of India, p. 57.
17. Corporate Tax Rates Slashed to 22% for Domestic Companies and 15% for New Domestic Manufacturing Companies and Other Fiscal Reliefs, Ministry of Finance, Press Release, 20 September 2019, https://pib.gov.in.
18. “Excise Duty on Petrol was Rs 9.48/ltr, Diesel Rs 3.56 in 2014: Minister”, 1 August 2022, https://www.business-standard.com; “Rajya Sabha Unstarred Question No. 278 to be Answered on 3rd February, 2021: Hike in Cost of Petrol/Diesel”, Rajya Sabha Debates, https://rsdebate.nic.in.
19. “Contribution to Central and State Exchequer”, Petroleum Planning and Analysis Cell, https://ppac.gov.in; Income from GST is from Union Budget documents, various years.
20. This figure does not include the dividend income of the Centre from the petroleum sector and ‘Profit Petroleum on exploration of Oil/ Gas’ to the Centre. Both these are also indirect taxes and total Rs 2.45 lakh crore (for the period 2014–15 to 2023–24).[Source: “Contribution to Central and State Exchequer”, ibid.] Including this, the total indirect tax income of the Central Government from the petroleum sector increases to Rs 32.69 lakh crore.
21. Our calculation, based on Union Budget figures of various years. For 2023–24, we have taken the Revised Estimates.
22. Our calculation. Based on data for tax revenues of Centre and States given in ‘Table 106: Direct and Indirect Tax Revenues of Central and State Governments’, in the RBI publication, Handbook of Statistics on Indian Economy (2022–23), available at https://m.rbi.org.in. Tax data for States for 2021–22 is RE, and for 2022–23 is BE. For Centre, data for 2021–22 and 2022–23 is actuals, calculated from budget documents.
23. “Survival of the Richest: The India Story”, Oxfam Report, 15 January 2023, https://www.oxfamindia.org.
24. Our calculation. This calculation is for the period 2014–15 to 2023–24. For States own revenues, we have taken data from the RBI publication, State Finances: A Study Of Budgets, December 2023, https://m.rbi.org.in. Here, by States own revenues, we mean tax and non-tax own revenue receipts of States. For the Centre, we have taken the latest data from budget documents.
25. “Methodological and Statistical Appendix. IMF Fiscal Monitor”, April 2024, https://www.imf.org.
26. Our calculation. We assume the tax-to-GDP ratio for 2024–25 to be 18%. Budget 2024 estimates nominal GDP for 2024–25 to be Rs 3,26,36,912 crore. Working backwards, the total tax revenues of the Centre and States works out to Rs 58,74,644 crore. Estimated gross tax revenue for 2024–25 in Union Budget 2024 is Rs 38,40,170 crore (we have not deducted transfers to the NCCF/NDRF). Total tax revenues of States then works out to Rs 20,34,474 crore. For tax-to-GDP ratio to go up to 25%, total tax revenues of Centre + States would need to go up to Rs 81,59,228 crore, which will require the Centre’s gross tax revenues to increase to Rs 61,24,754 crore, an increase of Rs 22,84,583 crore.
27. Nitin Kumar Bharti, Lucas Chancel, Thomas Piketty, and Anmol Somanchi, “Towards Tax Justice & Wealth Redistribution in India: Proposals Based on Latest Inequality Estimates”,
World Inequality Lab, May 2024, https://wid.world.
28. Ibid.
29. Ibid.
30. Ibid.
31. We have discussed this in greater detail in our booklet: Is the Government Really Poor, Lokayat publication, Pune, 2018, http://lokayat.org.in. We have also discussed this in the context of the WB–IMF imposed Structural Adjustment Programme on the developing countries, including India, in our book, Neeraj Jain, Globalisation or Recolonisation?, Chapter 4, Part B, Lokayat publication, Pune, available online at https://lokayat.org.in. See also: Prabhat Patnaik, “The Humbug of Finance”, 5 April 2000, www.macroscan.org; “Keynes, Capitalism, And The Crisis: John Bellamy Foster Interviewed by Brian Ashley”, 20 March 2009, http://www.countercurrents.org.
32. These conditionalities are given in several articles available on the internet. See for instance: Eric Toussaint, “ABC of Debt System”, 6 March 2023, https://www.cadtm.org; “Independent Peoples Tribunal Report”, 9 October 2007, https://www.cadtm.org; These conditionalities are also discussed in several of our publications, such as: Neeraj Jain, Globalisation or Recolonisation?, ibid.
33. Our calculation, based on data for gross fiscal deficit given in the RBI publication, Handbook of Statistics on Indian Economy, 19 January 2001, PartI: Annual Series, “Table 88: Key Deficit Indicators of the Central Government”, https://rbidocs.rbi.org.in.
34. The projected GDP for 2023–24 as mentioned in the Union Budget documents of that year is Rs 3,01,75,065 crore.
35. For more on tax concessions to corporations given in Budget 2024–25, see: “Budget 2024: Modi 3.0 Govt Simplifies Taxes, Fosters Foreign Investments”, 23 July 2024, https://www.business-standard.com.
36. “GST Collection Hits ₹1.74 Lakh Crore in June; Finance Ministry Stops Monthly Data Release”, 5 July 2024, https://www.thehindubusinessline.com.
37. “To Be World Leader, Private Sector Must Be Key Driver of Growth: Sitharaman”, 21 February 2021, https://www.business-standard.com.
38. Neeraj Jain, “Budget 2023–24: What Is in it for the People? Part 1: The External Sector”, 9 April 2023, https://janataweekly.org.
Neeraj Jain is a social–political activist with an activist group called Lokayat in Pune, and is also the Associate Editor of Janata Weekly, a weekly print magazine and blog published from Mumbai. He is the author of several books, including ‘Globalisation or Recolonisation?’ and ‘Education Under Globalisation: Burial of the Constitutional Dream’.