Within a stagnant budget outlay, the Finance Minister has made a huge increase in the Centre’s capital expenditure (capex) for four successive years. To compensate for the increase in capex, the FM needs to reduce the budget spending on some other heads. The axe has fallen on welfare spending on the poor.

Public Social Sector Expenditures: India vs Other Countries
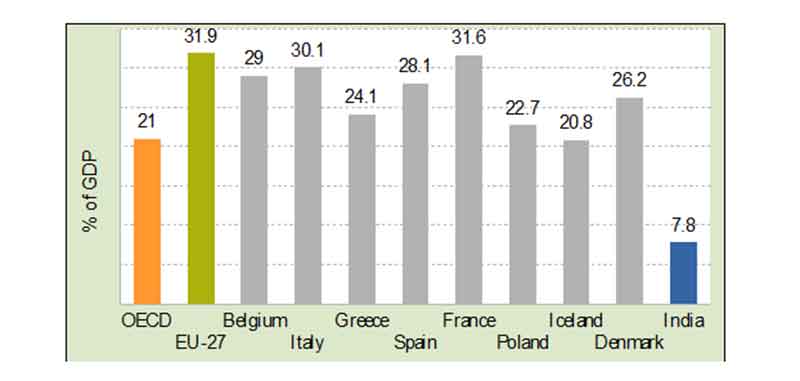
Most developed countries have a very elaborate social security network for their citizens, including unemployment allowance, universal health coverage, free school education and free or cheap university education, old age pension, maternity benefits, disability benefits, family allowance such as child care allowance, allowances for those too poor to make a living, and much more. Governments spend substantial sums for providing these social services to their people. The average public expenditure on social services of the 34 countries of the OECD has been around 21% of GDP for the last many years, and for the EU–27 have been even higher at nearly 32% of GDP. In contrast, Government of India’s expenditure on social services (Centre and States combined) is less than 8% of GDP (see Chart 1).
Since the per capita GDP of the developed countries is much more than India, so the per person social sector spending of the developed countries is many times more than that reflected by the above figures.
Chart 1: Social Sector Expenditure as % of GDP, 2022 [1]
Reduction in Welfare Spending During Modi Years
There are two important heads under which the government spends money on people:
- Subsidies: The most important subsidies given by the government as defined in its budget documents are food subsidy, fertiliser subsidy, and petroleum (LPF and kerosene) subsidy. (Note: the budget statement on subsidies also includes some other subsidies; we are excluding them from our discussion.)
- Social Sector Expenditures: Budget outlay for social sector ministries that directly benefit the people.
As we have pointed out in a previous article of this budget analysis series, because of low direct taxes and huge subsidies to corporate houses, Centre’s revenues are low. The budget outlay over the last 4 years (2020–21 A to 2024–25 BE) has increased by a CAGR of only 8.26%, which means it has increased marginally in real terms; and the budget outlay as a percentage of GDP has actually fallen by nearly 3 percentage points over this period.[2]
Within this stagnant budget outlay, the FM has made a huge increase in the Centre’s capital expenditure (capex) for four successive years. Consequently, capital expenditure as a percentage of budget outlay has nearly doubled over this period: from 12.1% in 2020–21 (Actuals) to 23% in this year’s budget estimate. We have discussed in a previous article of this budget analysis series that capital expenditure is yet another way by which the Modi Government is transferring public funds to big corporate houses.[3]
To compensate for the increase in capex, the FM needs to reduce the budget spending on some other heads. The axe has fallen on welfare spending on the poor.
i) The Subsidy Bill
The Modi Government’s expenditures on subsidies on food, fertilisers and petroleum are given in Table 1.
Table 1: Modi Govt’s Expenditure on Subsidies, 2019–20 to 2024–25 (Rs cr) [4]
As can be seen from the table, the pandemic (2020–21) saw a significant rise in the government’s subsidy bill, especially because of the huge increase in distribution of free foodgrains to the people badly affected by the unplanned lockdown. Since then, the subsidy bill of the Modi Government has sharply declined. The total expenditure on food, fertiliser and petroleum subsidies for 2024–25, even in nominal terms, is nearly half (54%) of that for 2020–21A.
Chart 2: Modi Govt’s Expenditure on Subsidies, 2014–15 to 2024–25 (Rs cr) [5]
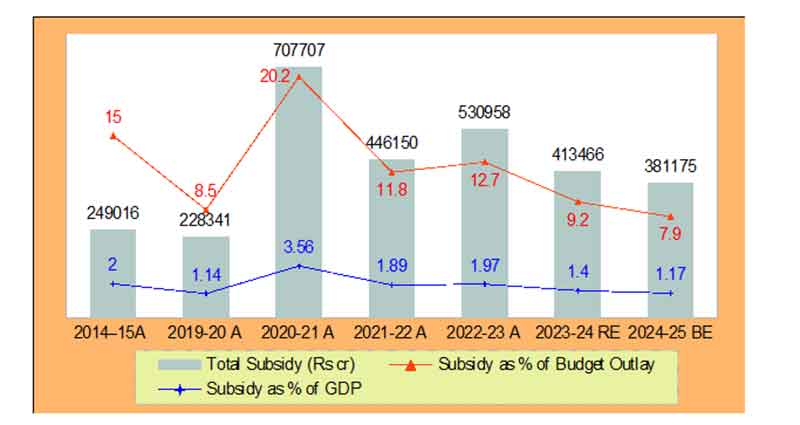
A better picture of the Modi Government’s spending on subsidies is obtained from Chart 2. The chart brings out in bold relief that the Modi Government had steeply reduced its subsidy bill during its first term — as a percentage of budget outlay, the subsidy bill had declined by 43% over the years 2014–15 to 2019–20. The pandemic forced the government to increase its subsidy bill in 2020–21 — mainly because of an increase in food subsidy spending that increased by more than 5 times, from Rs 1.09 lakh crore to Rs 5.41 lakh crore. Since then, despite the non-agricultural unorganised sector — that accounts for nearly 50% of the total employment — continuing to be in crisis, the Modi Government has again drastically reduced its spending on food, fertiliser and LPG / kerosene subsidy. The cut has been so steep that when compared to the allocation for 2014–15, the total subsidy in 2024–25 BE as a percentage of budget outlay has come down by nearly half (47%), and as a percentage of GDP it has declined by 40%!
ii) Reduction in Social Sector Expenditure
There is no standard definition of the ‘social sector’. The Economic Survey only gives a vague definition of the social sector.[6] Further, it gives data on combined social sector expenditures of the Centre and States, from which it is not possible to deduce the Centre’s social sector spending.
The Centre for Policy Research (CPR), a leading think tank of India that focusses on public policy,[7] has made an estimate of the Centre’s social sector expenditures. But its website also does not specifically mention the ministries that it has included in its definition. It only says: ‘social sector’ refers to education, rural development, health, water and sanitation, nutrition, social security and social justice, food security, urban poor welfare, tribal and minority affairs, employment, skill development, women and child welfare, sports and culture.[8]
So, we have drawn up a list of departments and ministries whose combined budget outlay can be considered to be the total social sector expenditure of the government of India. These include:
- Department of Food and Public Distribution
- Department of Health and Family Welfare
- Ministry of Ayush
- Ministry of Culture
- Ministry of Education
- Ministry of Environment, Forests and Climate Change
- Ministry of Housing and Urban Affairs
- Ministry of Jalshakti
- Ministry of Labour and Employment
- Ministry of Minority Affairs
- Ministry of Rural Development
- Ministry of Skill Development and Entrepreneurship
- Ministry of Social Justice
- Ministry of Tribal Affairs
- Ministry of Women and Child Development
- Ministry of Youth Affairs and Sports
We give our estimate of the social sector expenditures of the Central Government in Table 2. In the same table, we also present the estimate made by CPR of the Centre’s social sector expenditures (the CPR only gives the social sector expenditures as a percentage of the budget outlay). As can be seen from the table, our estimates closely match the CPR’s estimate.
Table 2: Modi Government’s Social Sector Expenditures, 2019–20 to 2024–25 (Rs cr)[9]
| 2019–20 A | 2020–21 A | 2021–22 A | 2022–23 A | 2023–24 RE | 2024–25 BE | |
| Social Sector Exp. – Our estimate (1) | 5,24,957 | 10,45,798 | 8,94,780 | 8,48,310 | 8,43,666 | 8,80,125 |
| (1) as % of Budget Outlay | 19.54 | 29.80 | 23.59 | 20.23 | 18.79 | 18.26 |
| Social Sector Exp. as % of Budget Outlay – CPR figure | 20 | 30 | 24 | 20 | 19 | 18 |
As can be seen from Table 2, the Modi Government’s expenditure on social services has continuously declined from 2020–21 to 2023–34 in nominal terms. It has increased this year, but is still below the level reached in 2021–22; and is 16% less than the social sector expenditure in 2020–21!
These figures do not reflect the full extent of the cut made by the Modi Government in its social sector outlay. That is better reflected in Chart 3. The chart gives the social sector expenditure of the Centre as a percentage of the total budget outlay, and as a percentage of the GDP (our estimates). Both have drastically fallen — as a percentage of the total budget expenditure, the social sector budget for 2024–25 is less than that for 2020–21 by 39%; and as a percentage of the GDP, it has halved!
Chart 3: Modi Govt’s Social Sector Expenditure*, 2019–20 to 2024–25 (Rs crore)
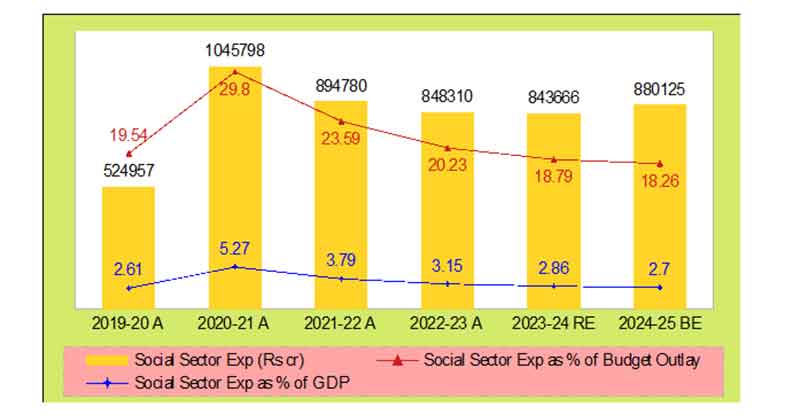
* Our estimate
Violation of Federalism: Reduction in Central Transfers to States
Another way in which the Modi Government has sought to compensate for its low revenues is by reducing its transfers to the States, in violation of the country’s federal structure.
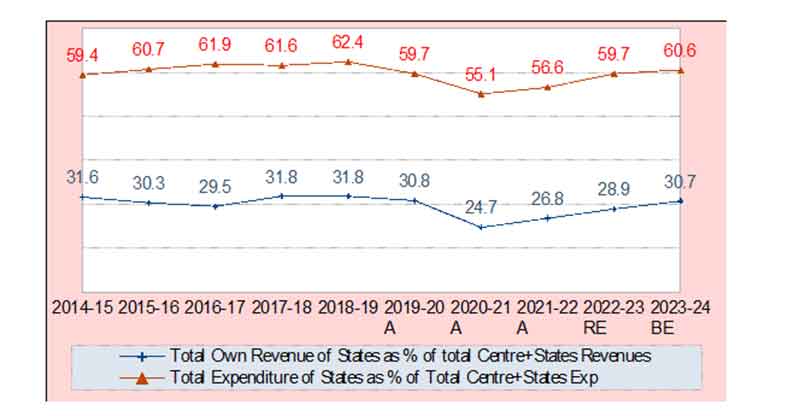
The Constitution grants the Union government more revenue raising powers while the States are tasked to undertake most of the development and welfare-related responsibilities. And so, the Centre collects the bulk of the revenues in the country; the States do not have many sources of revenue. This has got further skewed after the imposition of GST, that has further restricted the sources of revenues of the States. As we have discussed in a previous article of this budget series, presently, of the total revenues of the Centre and States (including Centre’s borrowings), the Centre collects around 70%, and the States the remaining 30% (the States’ share had fallen to as low as 24.7% in 2021–22 and 26.8% in 2022–23). On the other hand, of the total expenditures of the Centre and State governments, the States spend between 59 and 62 percent (See Chart 4).
Chart 4: Own Revenues of States as % of Total Centre+States Revenues, and
Total Expenditure of States, as % of Total Centre+States Expenditure [10]
This allocation of revenue raising powers and expenditure responsibilities results in an imbalance, and so the Constitution has made a provision for the setting up of a Financial Commission to determine the sharing of revenues between the Centre and the States. Successive Finance Commissions (FC) have attempted to reduce this imbalance by increasing the States’ share in Central taxes. The 14th FC recommended that the share of States in gross tax revenues of the Centre be 42% (for the period 2015–20), while the 15th FC marginally lowered this to 41% (for the period 2021–26). (The adjustment of 1% is to provide for the newly formed union territories of Jammu and Kashmir, and Ladakh, from the resources of the Centre.)
The Modi Government accepted both these recommendations. But it has resorted to a simple trick to deny the States their rightful share in Central revenues. Presently, as per the Finance Commission recommendations, the States are supposed to receive 41% of the ‘Divisible Pool’ of Centre’s tax revenues, defined as total tax revenue of the Centre minus the expenditure incurred for collecting taxes. But there is a loophole in this that enables the Centre to transfer a lesser portion as taxes. The loophole is, that taxes collected by the Centre in the form of cesses and surcharges are not included in the ‘Divisible Pool’ and are therefore not shared with the States.
- Divisible Pool of Centre’s revenues = [Gross Tax Revenues of Centre – Cesses and Surcharges – Expenses incurred for collecting taxes]
- States’ Share of Centre’s Tax Revenues = Divisible Pool of Centre’s Revenues x 41/100
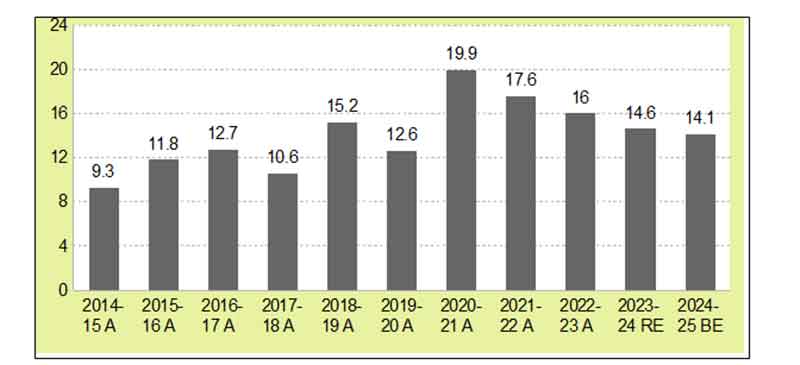
The Modi Government is blithely exploiting this ambiguity. It has been collecting more and more of its tax revenues as surcharges and cesses, to reduce its transfers to the States. During the first 7 years of the Modi Government, the share of cesses and surcharges in the gross tax revenue of the Centre (excluding the GST compensation cess which is exclusively given to the States) actually doubled, from 9.3% in 2014–15 to 19.9% in 2020–21. After that, their share has declined, but still remains at a high of 14.6% in last year’s RE and 14.1% in this year’s BE (Chart 5).
Chart 5: Cesses and Surcharges as % of Gross Tax Revenues of Centre, 2014–15 to 2024–25 [11]
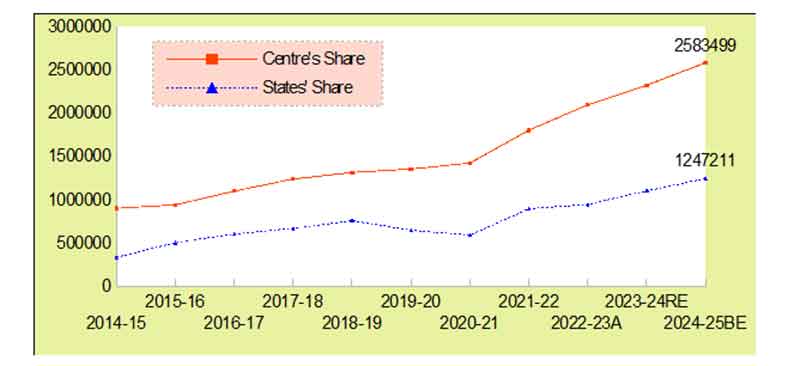
With the shrinking of the divisible pool, the share of the Centre’s gross tax revenue (GTR) going to the States has stagnated, while the Centre’s kitty has continued to rise. This can be seen from Chart 6. Note that even during the pandemic years, 2019–20 and 2020–21, when the GTR took a hit, the States’ share of GTR (this is called ‘Devolution of States share in taxes’ in the Union Budget papers) recorded a steep fall of 15% and 19% respectively, but the Centre’s revenues continued to rise because the Centre beefed up its revenues by hiking cesses and surcharges, which are not shareable with the States.
Chart 6: Distribution of Gross Tax Revenue Between Centre and States, 2014–15 to 2024–25 (Rs cr)[12]
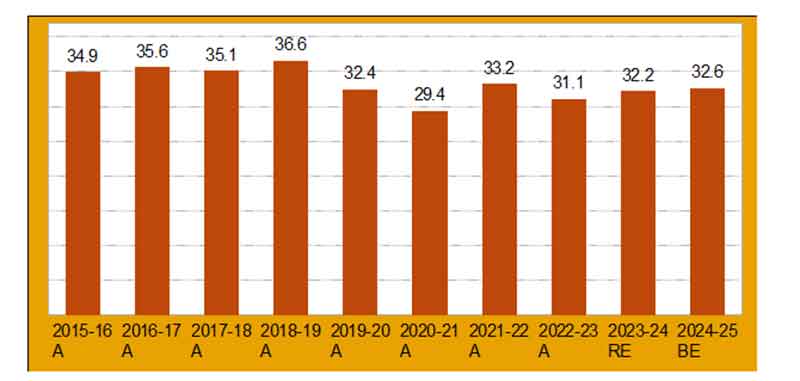
Consequently, the actual share of the States in the gross tax revenue of the Centre has never reached the mandated level of 41–42%. The 14th FC recommendations came into effect from 2015–16. As we can see from Chart 6, the transfers to States as percentage of gross tax revenues have been well below the recommended 42% for the entire period from 2015–16 to 2024–25 BE. They increased from 34.9% in 2015–16 to 36.6% in 2018–19 A, before declining to even below the 2015–16 level, and are at 32.6% in 2024–25 BE. The gap between the share recommended by the FC and the actual devolution is a huge 8.4 percentage points.[Chart 7]
Chart 7: State’s Share in Gross Tax Revenues (%)[13]
Let us calculate the revenue losses of the States for 2023–24, due to this undemocratic behaviour of the Centre, which goes against the federal spirit of the Constitution:
- For 2024–25, total gross tax revenue = Rs 38.31 lakh crore [we have deducted the amount transferred to NCCF/NDRF from gross tax revenue]
- 41% of this = Rs 15.71 lakh crore
- Actual amount transferred to States from gross tax revenue (as per this year’s Union Budget documents) = Rs 12.47 lakh crore
The States are going to lose Rs 3.23 lakh crore in revenue this year due to the Centre resorting to collecting revenue through cesses and surcharges instead of taxes. This means that the States are going to suffer a loss of 20.6% in their share of Central tax revenue in FY 2024–25 as mandated by the FC!
Even constitutional institutions such as the RBI and the CAG have adversely commented on this denial to the States of their rightful share of Central tax revenues. In 2019, the Reserve Bank of India (RBI) had noted that levying cesses and surcharges neutralises the increase in tax devolution recommended by successive Finance Commissions. Both the 14th and the 15th Finance Commissions also disapproved of the increasing tendency of the Centre to collect revenues through cesses.[14]
With the Centre resorting to tricks to reduce the tax transfers to the States, they are being pushed into a corner, and are forced to approach the Centre for special funding. This gives the Centre the power to play favourites, and penalise those States which oppose it politically — affecting the federal structure of the country. This is precisely what the Modi Government is doing.[15]
Impact on Social Sector Spending of States
As discussed above, of the total total revenue of the Centre and States, the Centre collects roughly 70%, and the States’ own revenue is 30%. In contrast, the major part of the social sector expenditure in India is undertaken by the States — around 70 to 80%.[16]
To compensate for this imbalance, the Centre transfers a portion of its revenues to the States. But with the Centre resorting to collecting revenues as surcharges and cesses in order to deny States their rightful share in Central revenues, the total transfers to the States from the Centre as a percentage of the total revenues of the States has fallen to 42.5% in 2023–24 BE from 47.9% in 2020–21 A and 45.4% in 2015–16 A.[17]
If the Centre financially squeezes the States by reducing its transfers to them, then their social sector spending is obviously going to get hit.
This, plus the low spending of the Centre on the social sectors, is what is responsible for the abysmally low total social sector expenditures of the Government of India (Centre + States combined). It is less than 8% of GDP (as admitted by the Economic Survey 2023–24). This figure is one-third of the average for the OECD countries, and one-fourth of the social sector spending of the EU–27!
Social Sector Expenditure and Employment
We have pointed out above that within its stagnant budgetary outlay, the Modi Government has hugely increased its capital expenditure, and to compensate for this, has reduced its social sector expenditures. This is an important reason for India’s terrible employment crisis. Let us explain.
It is well established economics that rupee for rupee, social sector expenditure is more employment generating than public capital expenditure. (Furthermore, in a situation where the country is facing such a terrible unemployment and poverty crisis, social sector expenditure directly benefits the working people. In the face of lack of demand due to poverty and unemployment, capex is not going to lead to increase in private investment and hence employment as we have argued in a previous article [18]; but increase in expenditure on social services puts purchasing power in the hands of people, and so pushes the private sector to invest in creating productive capacity, thereby leading to employment generation.) Not only that, much of the capex only goes towards boosting imports of capital goods, rather than strengthening domestic production. This further reduces the employment generation that should have taken place with increase in capex.
Even within the capitalist framework, there is a huge potential for creating public sector jobs in India in the social sectors. To make an estimate of this, let us compare public employment in India with that in the developed countries. The Modi Government has been claiming that it is working hard to transform India into a developed country. While it is true that the developed countries — from Germany, France and the United Kingdom to the USA — are all free market economies or capitalist economies, our readers would be surprised to know that the number of people in public employment as a percentage of the total population in the developed countries is as much as 7 to 14 times that of India (Table 3)! The reason why public sector employment in these countries is so high is because governments in these countries spend huge sums to provide social services to their people. In contrast, as we have discussed above, the Indian Government’s social sector expenditures are very low.
Table 3: Public Sector Employment as % of Total Population [19]
| Sweden | 14.29 |
| France | 8.62 |
| UK | 8.08 |
| USA | 6.84 |
| India | 1.28 |
The USA has one of the lowest levels of public sector employment among the developed countries — 6.84% of its population is employed in public sector jobs. This ratio for India is even lower at just 1.28%. Even if India were to increase its social sector expenditure to bring public employment in the country to half that of the USA, India’s public employment would increase to 4.7 crore.[20] India’s public sector employment is around 1.7 crore at present.[21] This means the creation of an additional 3 crore jobs in the social sectors!
Since the Centre collects the bulk of the revenues in the country, the responsibility for increasing social sector spending lies mainly with the Centre. If the Centre increased its social sector spending, and also increased its transfers to the States, so as to double the country’s total social sector spending from 8% of GDP to 15% (not a very large sum; the social sector spending of the OECD countries is 21% of GDP, and their per capita social sector spending is several times more than India), that would:
- lead to a huge improvement in social services and result in a huge leap in the living standards of the entire people, including the most marginalised sections;
- lead to the creation of crores of jobs in the public sector, and at least an equal number of jobs in the private sector because of the multiplier effect — thus resolving the country’s terrible unemployment crisis.
Is it possible for the Centre to increase its revenues and increase the total social sector expenditure of the country to 15% of GDP?
Subscribe to Our Newsletter
Get the latest CounterCurrents updates delivered straight to your inbox.
As per the Economic Survey 2023–24, the total social sector expenditure of the Centre and States in 2023–24 BE was Rs 23.51 lakh crore, which was 7.8% of the GDP. For this to increase to 15% of the GDP would require the total social sector expenditure to go up to Rs 45.21 lakh crore. Since the Centre has much greater flexibility in increasing revenues, let us assume that the Centre takes the entire responsibility for financing the required increase in revenues (of Rs 21.7 lakh crore). That may appear to be huge, and impossible, but is actually very doable. In a previous article of this budget analysis series, we have given the main findings of a study by a team of economists led by Thomas Piketty and Lucas Chancel at the World Inequality Lab in Paris on the extent of inequality in India. They estimate that levying a 3 to 5% wealth tax and a 45 to 55% inheritance tax on those with net wealth above Rs 10 crore {these are the top 0.04% of the adult population (~ 370,000 adults), who currently hold over a quarter of the total wealth in the country} would generate an annual tax revenue of 5.82% of GDP (for 2022–23); updating their calculations to 2024–25, we estimate that it would earn the government an annual tax revenue of Rs 20 lakh crore.[22]
We discuss our proposals in a later article in this series.
Notes
1. Source for OECD: “Social Spending”, https://data.oecd.org, accessed on 4 October 2024; for EU: Government Expenditure by Function – COFOG, https://ec.europa.eu; for India: Economic Survey, 2023–24. EU–27 figure includes general government expenditure on education, health and social protection (this includes sickness and disability, unemployment, old age, housing, etc). While the 2023–24 Economic Survey projects the social sector spending to be 7.8% and 8.0% for 2023–24 BE and 2022–23 RE respectively, the fact is, the Modi Government has been exaggerating its social sector expenditures in the Budget Estimates and Revised Estimates; based on the experience of past years, this figure should turn out to be around 7.5% when the actual figures come out in 2025.
2. Neeraj Jain, “Analysis of Budget 2024–25 from a People’s Perspective, Part 4: The Budget Outlay”, 14 September 2024, https://countercurrents.org.
3. Neeraj Jain, “Analysis of Budget 2024–25 from a People’s Perspective, Part 6: The Real Reason Behind Increase in Capital Expenditure”, 4 October 2024, https://countercurrents.org.
4. Data for subsidies taken from Budget at a Glance, Union Budget Documents, various years.
5. Ibid.
6. For the Economic Survey’s definition of social sectors, see: Economic Survey, 2023–24, Government of India, p. 210.
7. Centre of Policy Research is one of the national social science research institutes recognized by the Indian Council of Social Science Research (ICSSR).
8. For CPR’s definition of social sectors, see: “The Evolution of India’s Welfare System from 2008–2023: A Lookback”, Accountability Initiative, https://cprindia.org.
9. Our estimate of Modi Government’s social sector expenditures is made by adding up the budgetary outlay of the social sector related ministries. The CPR’s estimate for social sector spending as percentage of budget outlay is taken from: “Budget FY 2024–25 (Interim): The Last Decade of Social Spending”, Accountability Initiative, CPR, https://accountabilityindia.in.
10. Our calculation. For Revenues: For States, we only take States’ own revenues (tax and non-tax) and exclude their borrowings. For Centre, we include borrowings. For States own revenues, we have taken data from the RBI publication, State Finances: A Study Of Budgets of 2023–24, December 2023, https://m.rbi.org.in. For the Centre, we have taken the latest data from budget documents. For Central transfers to States also, we use data from Union budget documents. For expenditures: We have calculated the total budget expenditure of the States from data given in: State Finances: A Study of Budgets of 2023–24, ibid. For the Centre, we have taken the total budget outlay of the Centre, and deducted the transfers to the States made from within the budget outlay.
11. Data for Chart 5 taken from: Walking the Tightrope: An Analysis of Union Budget 2023–24, CBGA, Delhi, 2023, https://www.cbgaindia.org; and Revisiting the Priorities: An Analysis of Union Budget 2024–25, CBGA, Delhi, 2024, https://www.cbgaindia.org. Similar figures given in: “Finances of the Central Government (2019–20 to 2024–25)”, PRS India, 23 July 2024, https://prsindia.org. Note that GST cess is not included in above figure, as it is meant for the specific purpose of sharing with States.
12. Source for Chart 6: Union budget documents, various years.
13. Our calculation. See also: “Finances of the Central Government (2019–20 to 2024–25)”, op. cit.
14. “Centre’s Cess Cleverness Is Taxing States”, 22 February 2024, https://www.deccanherald.com.
15. See for instance: C.P. Chandrasekhar, “Politics Over the Purse”, 20 August 2024, https://frontline.thehindu.com; Arun Dev et al., “Inside the Centre vs States Battle Over Funds”, 8 February 2024, https://www.hindustantimes.com.
16. Resource Sharing between Centre and States and Allocation across States: Some Issues in Balancing Equity and Efficiency, Institute of Economic Growth, July 2019, https://fincomindia.nic.in — this document gives the States’ share at around 80%.
17. Our calculation. Here, the Centre’s transfers to States include both the share of the States in Centre’s gross tax revenues, and the Centre’s transfers from its own budget outlay. We have sourced the data on total revenues of States (this excludes States’ borrowings) and Centre’s transfers to States from: State Finances: A Study of Budgets of 2023–24, op. cit.
18. Neeraj Jain, “Analysis of Budget 2024–25 from a People’s Perspective, Part 6: The Real Reason Behind Increase in Capital Expenditure, op. cit.
19. Calculation done by us. For developed countries, public sector employment data taken from: “Employment in General Government”, given in Government at a Glance 2023, OECD, p. 181, https://www.oecd-ilibrary.org; total employment figures taken from: OECD Labour Force Statistics 2022, https://www.oecd-ilibrary.org; population figures taken from: Population, Total – OECD Members (population figures for 2022), https://data.worldbank.org. Public sector employment figure for India taken from: R. Nagaraj, “Public Sector Employment: What has Changed?”, 2014, http://www.igidr.ac.in. It gives data for 2012. The Modi Government has stopped releasing public sector employment figures; we assume that public sector employment in India is the same as it was in 2012, though it has fallen considerably since then. Population figure for India for 2022 taken from: Census of India 2011: Population Projections for India and States 2011–2036, Ministry of Health and Family Welfare, November 2019, https://nhm.gov.in.
20. Total population in 2022 was around 137.37 crore (Taken from: Ibid); 137.37 x 6.84/100 x0.5 = 47.
21. R. Nagaraj, op. cit. We assume that the total public sector employment has remained the same as in 2012. Since then, the permanent public sector employees have not increased; the increase has only been in contractual employment, so we are not including them in the public sector employment.
22. Neeraj Jain, “Analysis of Budget 2024–25, Part 1: Declining Budget Outlay”, op. cit.
………………………………………………………………………………………….
Neeraj Jain is a social–political activist with an activist group called Lokayat in Pune, and is also the Associate Editor of ‘Janata Weekly’, a weekly print magazine and blog published from Mumbai. He is the author of several books, including ‘Globalisation or Recolonisation?’, ‘Nuclear Energy: Technology from Hell’, and ‘Education Under Globalisation: Burial of the Constitutional Dream’.