We often hear the statement, “When oil supply is lower, oil prices will rise because of scarcity.” Now, we are getting to see firsthand whether oil prices really do rise, as oil supplies become more scarce.
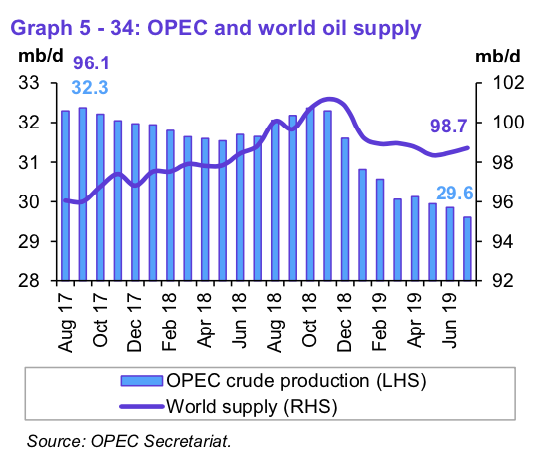
Figure 1. Figure from the OPEC Monthly Oil Market Report for August 2019 showing world and OPEC oil production by month.
Figure 1 shows that world oil supply hit a peak in November 2018 and has declined since then, mostly because of a decline in OPEC’s production. So, total oil production seems to be down for about eight months, relative to the peak in November 2018.
Despite this big cutback by OPEC in its oil production, prices have not responded as OPEC had hoped:

Figure 2. Average monthly spot Brent Oil prices, based on EIA data.
In fact, as I write this, Brent oil price is currently quoted as $60.48, which is back in the range of December 2018 and January 2019 low prices. Also, reducing production doesn’t seem to be reducing inventories. Figure 3 suggests that they are now higher than they were before the reduction in oil supply took place.
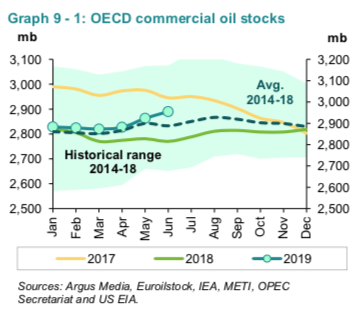
Figure 3. Figure from the OPEC Monthly Oil Market Report for August 2019 showing OECD commercial oil stocks.
Why aren’t oil prices rising and oil inventories falling, if oil production has fallen?
The basic issue is that the economy is very much interconnected under the laws of physics, because energy is required for every activity that is considered part of GDP. Energy is required for any kind of heat or any kind of movement. Energy is even required for electricity. Without energy from the sun, food can’t grow; without supplemental energy of some kind (such as using electricity to heat an electric stove or burning animal dung or sticks), it becomes impossible to cook food or smelt metals.
One strange phenomenon that arises from the interconnected nature of the economy is the fact that the prices of all energy products (including those not listed on Figure 4) tend to move together.
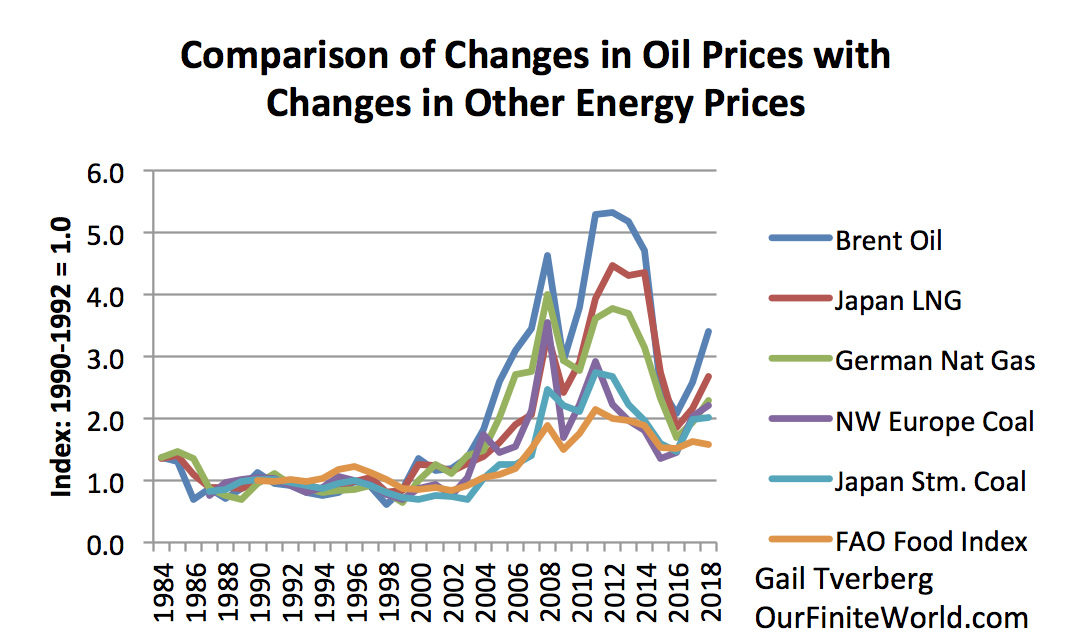
Figure 4. Comparison of changes in oil prices with changes in other energy prices, based on time series of historical energy prices shown in BP’s 2019 Statistical Review of World Energy. The prices in this chart are not inflation-adjusted.
This strange phenomenon arises because energy products are well-buried within every part of the world economy. A person’s job requires energy consumption. The tasks that governments do, such as building roads and schools, require energy consumption. Both transporting and cooking food require the use of energy products. Refrigerating food requires energy products. These energy uses, as well as many other everyday hidden uses of energy, aren’t things that we can easily cut back on.
Consumers often think, “I will drive less, and that will cut back on my energy consumption.” Unfortunately, in the whole scheme of things, whether or not individuals cut back on their optional use of gasoline doesn’t get the world economy very far. Gasoline accounts for about 26% of world oil consumption, or about 8.7% of total energy consumption, based on the most recent BP energy data. Cutting back on the optional use of gasoline would not reduce total consumption very much. If it were possible to reduce gasoline consumption by 10% by voluntary cutbacks, it would still reduce world energy consumption by less than 1%.
The strange pattern of the price changes shown on Figure 4 indicates that there is something affecting energy prices of many kinds, simultaneously. I would describe this as “affordability.” It has to do with how affordable finished goods and services are to the population in general, much more than it does scarcity. (Economists call this affordability issue “demand.”) If finished goods and services are affordable to a large number of consumers, as they were in 2008 and in 2012 and 2013, prices will be bid up to very high levels (Figure 4). If finished goods and services aren’t very affordable, a drop-off in prices, such as that experienced in November and December of 2018 (Figure 2), is likely to occur.
When OPEC decided to cut back its production of oil in response to the low prices in late 2018, this cutback in oil production didn’t help the affordability of finished goods and services. In fact, this cutback probably made the worldwide total quantity of affordable finished goods and services a little lower. This happened because, with the cutback in oil production, the governments of OPEC countries were able to collect less tax revenue on the smaller quantity of oil that the countries were selling. In fact, this smaller quantity of oil wasn’t even being sold at a higher price.
With lower revenue, governments of OPEC countries are being forced to cut back on funding of new projects such as roads and schools. These projects will use fewer energy products, and the would-be workers will have less money to spend on goods made with energy products. Thus, these cutbacks help to lower the world’s “demand” for oil and other energy products and thus help lower the price of oil.
The fact that the economy is interconnected in this strange way makes shifting prices upward much more difficult than if scarcity were the primary issue. In effect, the whole stack of energy prices in Figure 4 must somehow be made to rise. This is difficult to do because it is the lack of wages of the many poor people around the world that is holding back “demand” for energy products. If, somehow, higher wages could be sprinkled on the many poor workers of the world, including those in India and Africa, then oil (and other energy) prices would tend to rise. With higher wages, these poor people would be able to afford items such as nice homes, cars, and air conditioning, pulling world food and energy demand upward.
One difficulty with rising oil (and other energy) prices: They don’t translate into rising wages.
Rising oil prices tend to cause recessions and layoffs. We can see this from historical data. Average wages, considering layoffs, tend to fall rather than rise during times of spiking oil prices. In fact, the chart seems to suggest that the big increases in average wages tend to occur when oil prices are under $40 per barrel. A growing supply of cheap energy thus seems to be the magic ingredient that shifts wages upward.
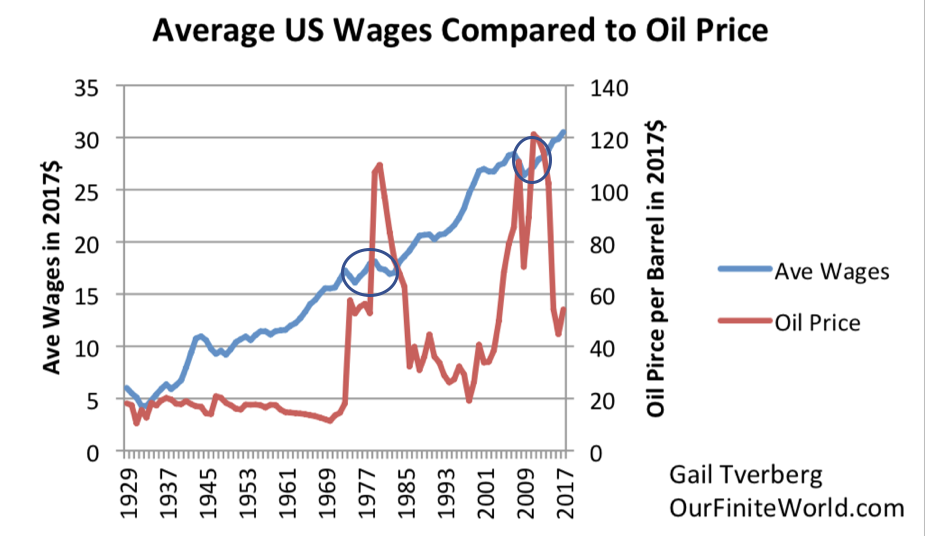
Figure 5. Average wages in 2017 US$ compared to Brent oil price, also in 2017 US$. Oil prices are from BP’s 2018 Statistical Review of World Energy. Average wages are total wages based on BEA data adjusted by the GDP price deflator, divided by total population. Thus, they reflect changes in the proportion of population employed as well as wage levels.
Because of this difficulty with spiking energy prices, high energy prices tend not to last for very long. One issue is that regulators quickly raise short-term interest rates to solve what they perceive as “the problem of rising food and energy prices.” Once recession sets in (gray bars in Figure 6), regulators find that they need to lower interest rates and raise the level of debt to stimulate the economy again. With lower interest rates and more debt, major purchases (such as homes, cars, and factories) become more affordable, because purchases bought on credit have lower monthly payments. With greater affordability, food and energy prices again rise, to again encourage more production.
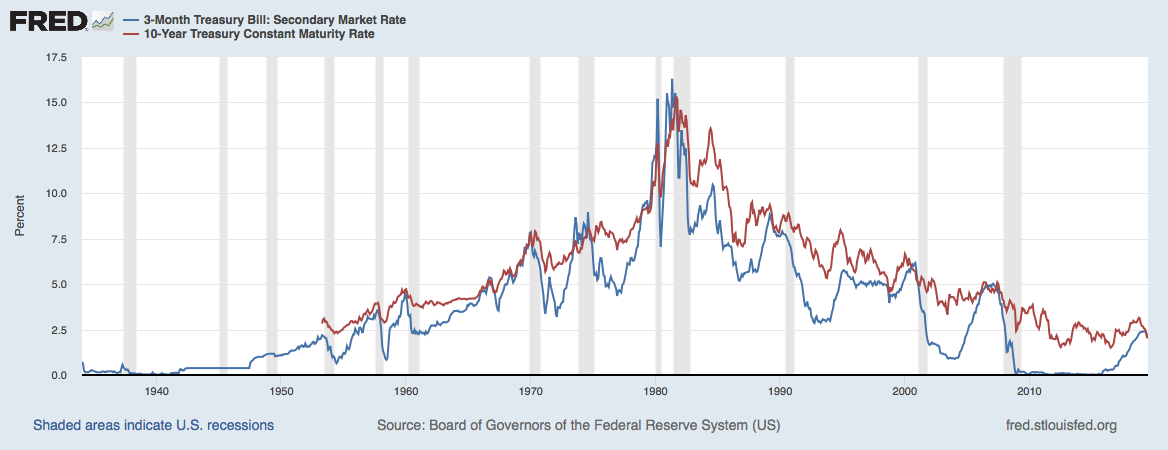
Figure 6. Three-month and ten-year interest rates through July 2019, in chart by Federal Reserve of St. Louis.
So we end up with an endless see-saw of energy and food prices. In fact, the peaks have tended to fall lower and lower since 2008, as can be seen in Figure 7, showing monthly average prices.

Figure 7. Monthly average Brent Oil prices since January 2000, based on data of the US Energy Information Administration.
Monthly average peaks started at $132.72 in July 2008. More recently, peaks have fallen as follows:
- Peak of $125.25 for the month of March 2012
- Peak of $109.54 for May 2014.
- Low month average price of $30.70 in January 2016.
- Most recent average peak was $81.03, for the month of October 2018.
From this pattern of falling peaks, we can see that the stimulus being used recently (which includes Quantitative Easing in some parts of the world) has become less and less effective at stimulating demand for food and energy products.
It looks as though growing debt at ever-lower interest rates is becoming a less effective workaround for the economy’s real need, which is a need for a rapidly growing supply of under $40 per barrel oil and other low-priced energy products.
Oil prices can be a problem in two different directions: (a) Too high for consumers or (b) Too low for producers.
From the Point of View of the Consumer. Many people have had the “Ah Ha” moment, in which they have figured out that high oil prices are a problem from the point of view of consumers. In part, they have deduced that these high oil prices may mean that we are “running out” of cheap-to-extract oil. Processes are becoming more complex, and as a result, consumers need to pay more to cover the higher cost of extracting and refining the oil.
But there is a related issue: Higher oil prices are likely to cause recession. If oil prices rise, the prices of many different types of goods and services (such as food, goods transported by truck or airplane, and vacation travel) rise at the same time. Wages don’t rise as quickly, in part because it is the true energy content (measured in Btus, barrels of oil equivalent, or something similar) that the economy requires. If the economy needs to dedicate a larger share of its resources to producing energy products, this is an issue that is akin to growing inefficiency. There are fewer resources remaining (such as human labor, metals, fresh water, and energy products) for investment that might provide goods such as new homes, cars, clothes, and air conditioning.
With fewer resources to use, the economy reacts by shrinking back. I think of the situation as being akin to the way a chemist might “make a smaller batch,” if the quantity of one necessary reagent is low. An adequate supply of energy products is what makes the economy operate as it does; if buying an adequate amount of energy products becomes too expensive for consumers, a cutback in the buying of discretionary goods is forced on the economy (Figure 8). Lowering interest rates tends to make the debt repayment portion on new purchases lower, helping to alleviate the squeeze.

Figure 8. Chart made by author in 2010, to illustrate a talk called Peak Oil: Looking for the Wrong Symptoms.
From the Point of View of the Oil Producer. There are oil producers of many kinds, including:
- Tight oil producers from shale operations,
- Heavy oil producers in places such as Canada and Venezuela,
- Producers of oil from deep water such as Brazil and Angola, and
- Middle Eastern oil exporting countries that seem to have a very low direct cost of oil production.
Strange as it may seem, Middle Eastern oil exporting countries are among the most vulnerable to problems associated with continued oil low prices. The reason why these countries are so vulnerable is because their entire economies are oriented toward oil and gas production. They often have large populations with inadequate employment opportunities unless the government provides them with handouts or with programs that provide jobs. If these governments need to cut back too much, there is a real danger that the governments will be overthrown. In fact, the population may break down into warring factions. Oil production may stop because of internal disorder.
It is because of issues such as these that the OPEC countries have cut back on oil production, in the hope that prices would rise to more acceptable levels for their countries. Fiscal Breakeven prices, relating to the level of oil prices that are needed so that each government can collect sufficient taxes for its budget, are published from time to time.

Figure 9. Chart published by the Arab Petroleum Investments Corporation (APICORP) giving Fiscal Breakeven Prices estimated to be needed for 2013.
Now that oil prices have been low since late 2014, Middle Eastern countries won’t admit to the true level of oil prices that are needed to operate their countries in the way that they have in the past. Their populations have been rising faster than their oil production, so it is hard to believe that the oil prices that the countries truly need, if they do not cut back on programs, are any lower than the amounts shown in Figure 9. At about $60 per barrel, the current Brent Oil price is clearly far too low for the major oil producers of the Middle East.
Shale and heavy oil producers are often less vulnerable than Middle Eastern producers, because the entities funding their operations (that is, buyers of shares of stock and providers of debt) believe that “of course” oil prices will rise in the future because of scarcity. Because of this, they are willing to provide additional funding, even when a recent owner has gone bankrupt from low prices. Middle Eastern oil producers have less of this benefit. If the money isn’t available for major programs, they are forced to cut back. Growing debt is unlikely to cover more than a portion of the shortfall.
There are other producers in the energy price “stack” in Figure 4 that are vulnerable to collapse or bad outcomes from continued low energy prices. One example is coal producers in China. China seems to be experiencing Peak Coal because of continued low coal prices; While new mines have been opened, they do not act to increase the total quantity produced, because so many mines needed to be closed because they were losing money at current low prices.
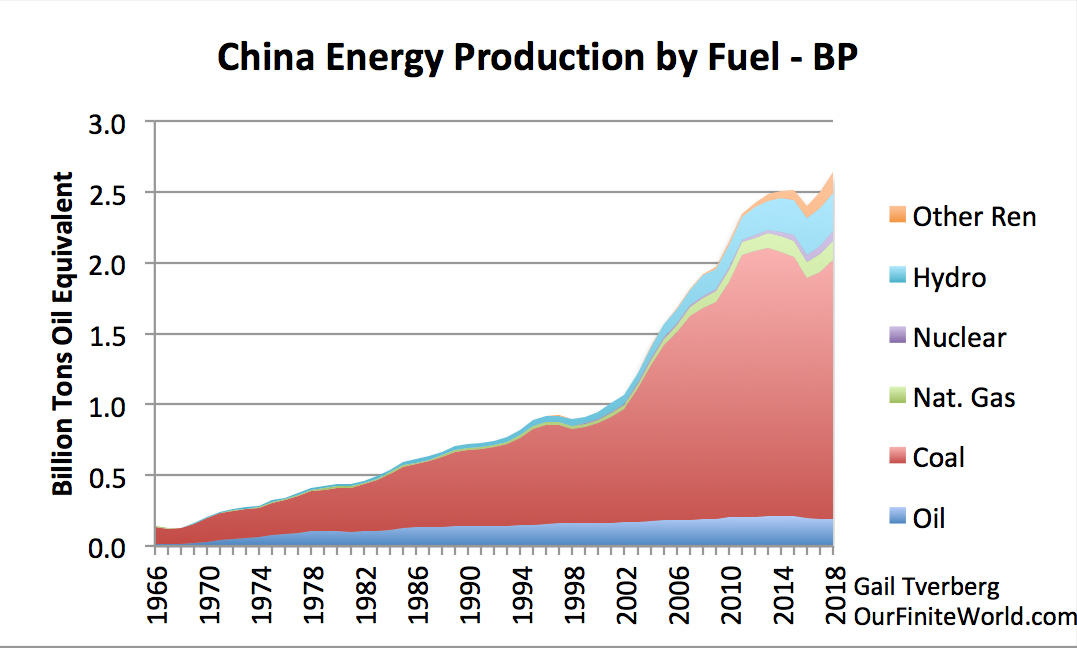
Figure 10. China energy production by fuel, based on 2019 BP Statistical Review of World Energy data. “Other Ren” stands for “Renewables other than hydroelectric.” This category includes wind, solar, and other miscellaneous types, such as sawdust burned for electricity.
If the world economy is hoping for China’s increasing demand to pull the world economy forward in the future, it is likely kidding itself. China cannot expect imports to make up for its lack of growth in coal production. China’s lack of adequate energy supplies likely underlies the tariff issue that we hear so much about. There is a need to pull back production of goods from China, if China doesn’t really have the energy resources to continue in the role it has been playing.
The big question is how high oil prices will be in the future
The contention of the IEA and many others is that energy prices can rise arbitrarily high. For example, the IEA showed the figure I have numbered Figure 11 in its World Energy Outlook 2015 .

Figure 11. IEA Figure 1.4 from its World Energy Outlook 2015, showing how much non-OPEC oil can be produced at various price levels.
The big groupings in Figure 11 are
- Conventional Crude (such as from the Middle East and perhaps deep water like Brazil),
- Tight Oil from Shale, and
- Extra Heavy Oil and Bitumen (such as from Canada and Venezuela).
Evidently, in 2015, the IEA believed that $300 per barrel oil prices were not too high to show as a possibility on a chart. With $300 per barrel oil, there would certainly be enough oil. At such a high price, it might be possible to move the city of Paris, France, out of the way and extract the tight oil from shale underneath it!
Unfortunately, in the real world, prices cannot rise this high. Market prices are set by the laws of physics. The economic limit we reach is a price limit that pushes the economy back into recession. We have seen in Figure 7 that this price limit seems to be dropping lower and lower, over time. In fact, I am one of the coauthors of an article published in the journal Energy called, An Oil Production Forecast for China Considering Economic Limits. This 2016 article makes the point that the economic limit we are reaching is a limit on how high oil prices can rise. I am the lead author of Section 2, which discusses this issue at length. If prices cannot rise high enough, the vast majority of the oil that seems to be available based on published reserve amounts and geological surveys cannot really be extracted.
Whether there are ways to raise oil and other energy prices higher than they are now remains to be seen.
Why don’t standard models forecast low oil prices in the future?
Economists have put together a simple model of how the economy works. In their model, there are always substitutes. The only thing that goes wrong seems to be that prices rise, if there isn’t enough supply. These rising prices encourage greater supply and substitution. The type of chart a person typically sees is a Supply and Demand curve as shown in Figure 12.

Figure 12. Supply and Demand model from Wikipedia.
Attribution: SilverStar at English Wikipedia CC BY 2.5 (http://creativecommons.org/licenses/by/2.5)%5D, via Wikimedia Commons
They have never considered a situation where energy products are deeply buried within essentially all goods and services that are made. If there isn’t enough supply, a “smaller batch” of the world economy is made. We think of this as recession, but it can take on other forms as well:
- Depression
- Wars
- Epidemics
- Defaulting debts; falling prices of assets
- Failing governments and intergovernmental organizations
- Collapse of the central government of the Soviet Union in 1991
- UK’s decision to leave the European Union
- Increasing conflict between political parties and between countries
- A reduction in globalization
- Ultimately, the collapse of a civilization
Economists have not understood the connection between physics and the economy. There is a need for a sufficient quantity of affordable energy products every moment of every day. In fact, we seem to need a vastly increased quantity of inexpensive-to-produce energy supplies right now if we are to fix the world economy’s problems from an energy point of view. The “lower interest rates and more debt” way of hiding problems seems to be reaching an end point. If nothing else, interest rates today are close to as low as they can go.
Is the economy approaching a singularity?
In physics and math, a singularity is a point at which a function takes an infinite value. We end up with a situation that seemingly cannot exist. It is like dividing the number 1 by the number 0. No matter how many times that the number 0 is added together, it will never equal 1.
The economy seems to be reaching an equally strange situation. It is not a situation where we are running out of oil; it is a situation of too much wage disparity, and this wage disparity makes the prices of many commodities too low for producers of these commodities. For example, farmers cannot afford to pay their mortgages. And prices for all fossil fuels and many metals are too low for companies extracting these materials to make an adequate profit for reinvestment and taxes. The problem is not simply low oil prices.
This situation of excessive wage disparity is related to globalization, with many workers around the world earning very low wages, so that they cannot afford goods such as homes and cars. It is related to the increased use of robots substituting for manual labor. It is also related to wage disparity within countries as jobs become increasingly specialized.
As this situation plays out, energy prices fall when common sense would seem to suggest that they should rise. In fact, the problem of falling prices extends to more commodities than fossil fuels and food; it extends to minerals of many kinds, including copper and aluminum.
In such a situation of falling commodity prices, we can expect many related problems. For example, governments of countries that depend on the revenue of these exports may fail, leading to Balkanization of these countries in some cases. A wide range of debt defaults can be expected, leading to failing financial institutions that need to be bailed out. Rapidly changing relativities among currencies are likely to put markets for derivatives at the risk of failing. Needless to say, stock markets are likely to be adversely affected. So-called renewables will quickly fail because they are currently dependent on fossil fuels for repairs and the electric grid. In fact, it is hard to see any aspect of the world economy that can continue unaffected.
How does what appears to be an approaching calamity play out?
Perhaps it is fortunate that we don’t really know. Collapses of early economies seemed to take many years, typically over 20 years. Today, the world economy depends on global supply chains and the electric grid. The financial system is also very important. It is hard to believe that the overall system can stay together for many years, but perhaps, in parts of the world, it can. We just don’t know.
Given how connected the economy seems to be, and how widespread the problems seem to be at the singularity we are reaching, it almost appears that there is a plan behind what is happening. From what we can observe, there seems to be some literal higher power behind all of the energy flows that we observe in the universe. This literal higher power seems to have put into place all of the laws of physics. This literal higher power seems to also be behind all of the self-organizing elements within the universe, including humans, ecosystems and economies. I cannot help but wonder whether there is some plan for what is ahead that we don’t understand.
Gail E. Tverberg graduated from St. Olaf College in Northfield, Minnesota in 1968 with a B.S. in Mathematics. She received a M.S. in Mathematics from the University of Illinois, Chicago in 1970. Ms. Tverberg is a Fellow of the Casualty Actuarial Society and a Member of the American Academy of Actuaries. Ms. Tverberg began writing articles on finite world issues in early 2006. Since March 1, 2007, Ms. Tverberg has been working for Tverberg Actuarial Services on finite world issues. Her blog is http://ourfiniteworld.com
SIGN UP FOR COUNTERCURRENTS DAILY NEWS LETTER


