The 2009 swine flu pandemic caused by a new strain of H1N1 virus infected as many as 1.4 billion people across the globe and killed between 151,700 and 575,400 people, during eight months according to the US Centre for Disease Control. The newly emerged coronavirus disease of 2019 (Covid-19) caused by SARS-Cov-2 virus is nowhere near that, at least as on 110th day of the outbreak.
The origin of the virus is still under debate. It was earlier thought to have come from bats via pangolins to humans. Scientists had almost unanimously rejected a theory of leakage from a weapon research laboratory. Some officials in China think that it jumped out of the backpack of an American soldier.

5000 yrs before present: Hamin Mangha” one of the best-preserved prehistoric sites in north-eastern China.
According to the European Centre for Disease Prevention and Control. There are 338,307 cases globally as on 23 March 2020. Two-third of these confirmed during the past 15 days. Of these, 14602 patients died; the crude mortality rate (per 100 infected) is 4.32.
The news and analyses, usually report the total number of cases and death by countries. To see things in perspectives, these numbers need to be translated into rates. Two rates we consider are (a) Attack Rate, which means the number of people infected per one million population and (b) Crude Fatality Rate, means death per 100 cases. This is called ‘crude’ because the Fatality Rate can be worked out only after all the patients are cured and discharged from the hospitals. All countries in the world today have covid-19 patients in the hospital.
Wuhan, the capital city of Hubei in China, is thought to be place where the virus emerged. The first patient is also from Wuhan. The dynamic of the epidemic in Wuhan is different from not only China, but also all other countries. I have divided the Chinese into two groups – from Wuhan and China-less Wuhan.
The attack rate per million populations in Wuhan is 3888, Italy is 978, China-less Wuhan is 10. India is not in the graph because the attack rate is far below 1.
Population: Wuhan has a population of about 6 million (present in the city at the time of epidemic). Rest of China has a population of 1400 M, which is almost twice as that of Europe.
Caseload:
There are 11 regions with caseloads above 5000. Italy is on top, Wuhan is the second, and Rest of China occupies the fourth position, behind USA.
Attack Rate
We place countries in two groups –
(a) the high attack rate of 200 or more per million people. There are 11 countries and the city of Wuhan in Central China which are in this league. Of this, Wuhan has the highest attack rate of 3800, while Bahrain has the lowest rate of 241 per million.
(b) in the second group there are 20 countries with attack rate 50 and 200 per million and China less Hubei province with an attack rate of 10 per million.
With an attack rate of 3884 per million people, Wuhan is on top. With a rate of 938, Italy is the second, Greece is the third region. Rest of China is not in this big league.
There are 18 countries/regions in the second attack rate group with <200/M. Rest of China with an attack rate of 10 per million holds the last position.
Total Deaths: We are looking at 10 countries/places with a total death above 100. Italy is on top with 5476 deaths, with 2306, Wuhan is in the second position. China-30 holds the ninth position with 151 deaths. In S Korea, 111 people died.
Crude Fatality Rate: Since different regions are in different phases of the epidemic, comparison of death rate is really meaningless. For instance, in Italy 80% of the patients are still under treatment while nearly 90% of the cases have been cured and discharged in China. Yet, we give this rate. Italy is on top, Greece holds the second position and Wuhan is the third. Rest of China’s rate is 1.2%. The rate in China is likely to go beyond 1.5% when the outcomes for all the patients would be known.
The results are presented in graphs below:
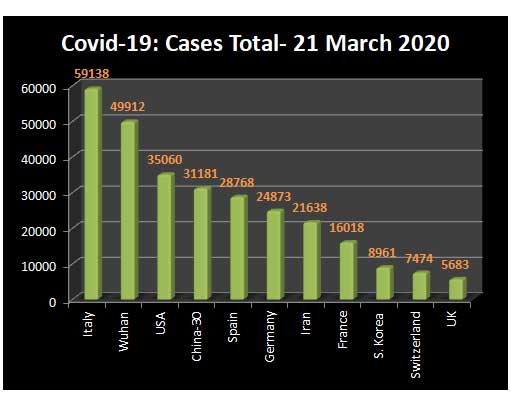
Figure-1 : Number of cases – country wise

Figure-2 Attack rate – countries in top league
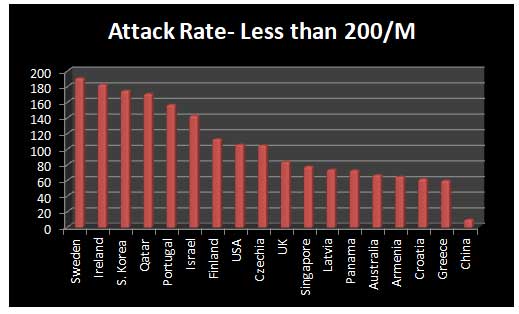
Figure-3 Attack rate – countries in middle position
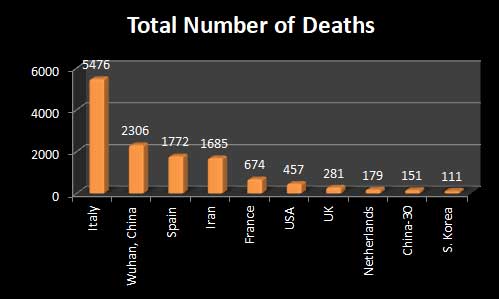
Figure – 4 : Total number of death- top 10 countries
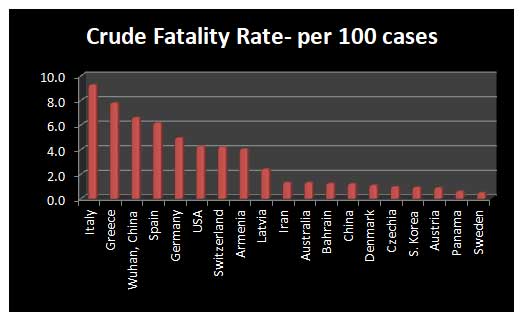
Figure – 5 : Crude Fatality rate
New Analysis of China
I have recently analysed the data for China, placing the patients in three groups, Wuhan city, Hubei province minus Wuhan and China minus Hubei. There were two kinds of quarantine in China. In Wuhan city and Hubei Province, there was the extreme kind of lock-down, with no public transport and no permission to go out of the homes except for essential shopping, pharmacies and hospitals. According to WHO, this kind of quarantine of 55 million people is “new to science”. In 30 other provinces of China, there community controls, but people could still move out and visit relatives etc.
My final analysis of China data shows that:
- The controls in Wuhan were highly successful during the first 11 days of the lock-down that is from 23 January to 03 Feb 2020. The infection rate in Wuhan was 1.1%, which is 3 times lower than that of other provinces of China.
- During the second phase – 04 Feb-07 March, the infection rate in Wuhan was 5.5%, which was five times higher than rest of China.
- My analysis also indicates that there was another epidemic caused by yet another unknown agent in Wuhan since February 2020, which caused Covid-19 like symptoms in about 40,000 people. This is an “unknown known” among the Chinese scientists and the WHO. They did not so far ask whodunnit.
My detailed analysis, 2500 words, can be read here.
In short, the community quarantines, social distancing and other measures worked extremely well in 30 provinces of China, where the attack rate is 10 per million people, which is about a hundred times lower than that of Italy. The unimaginably higher attack rates and death rates all over Europe and America are suggestive of the virus- SARS-Cov-2 acquiring some deadly mutations in the passages during the past several weeks.
So I fully support the proposals for the lock-down of India and Kerala, announced by the Prime Minister and the Chief Minister respectively. I also appreciate their decision to include alcohol vending outlets (known as beverage shops) as essential services – In spite of the noises from some ill-informed opposition politicians. The ingredients for making sanitizers for hand washing are alcohol, aloe-vera and lemon.
VT Padmanabhan is an epidemiologist. He conducted genetic epidemiological and occupation health studies among people living in high background radiation areas of Kerala, among the workers of the Indian Rare Earths and Gwalior Rayons in Nagda, Madhyapradesh and the survivors of gas leak at the Union Carbide (now DOW chemicals) plant at Bhopal. E-mail id: [email protected]
SIGN UP FOR COUNTERCURRENTS DAILY NEWS LETTER