India and China refrained from signing the Global Renewables and Energy Efficiency Pledge, a document endorsed by 123 nations in the COP28 held in UAE in the first half of December 2023. The pledge was inspired by an International Energy Agency document titled Net Zero Emissions by 2050: A Roadmap for the Global Energy Sector first published in 2021 and updated subsequently.
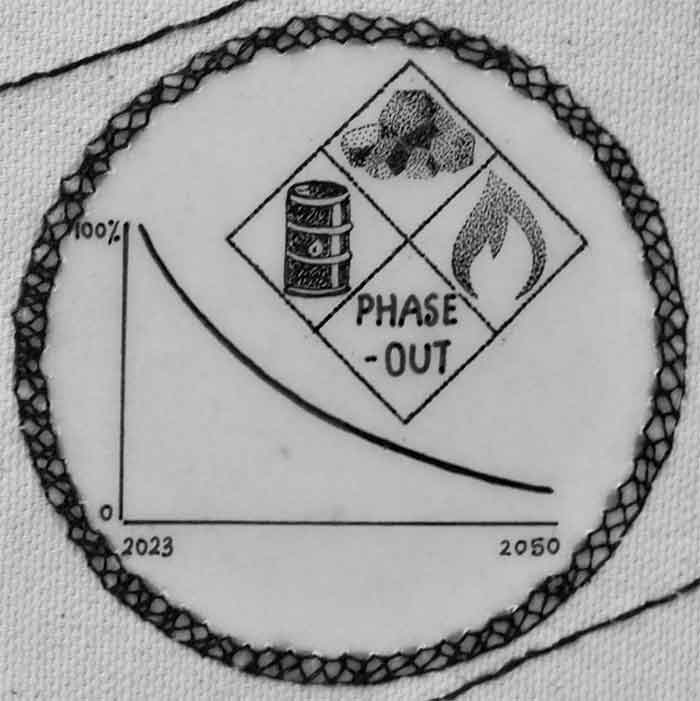
The pledge states that “to limit warming to 1.5°C, the world requires three times more renewable energy capacity by 2030, or at least 11,000 GW, and must double the global average annual rate of energy efficiency[ii] improvements from around 2% to over 4% every year until 2030 … and the phase down of unabated coal[iii] power, in particular ending the continued investment in unabated new coal-fired power plants.”
Since the 1997 Kyoto Protocol was signed, global power generation by both fossil fuels and renewable energies has grown. The former doubled, and the latter quadrupled though from its small 1997 base (Table 1). As the economies of the developed countries (Europe and North America) grew at a modest rate of 1-2% per annum (pa), their power generation increased only marginally, most of it by renewables. The high-growth large economies of India and China saw robust growth in the use of both fossil fuels (four to five-fold) and renewable energies (five to ten-fold).
If the global renewables’ power generation capacity is to treble to 11,000 GW (including hydro energy) by 2030, its current annual growth rate (Table 2) must double to 18% pa. The growth of renewable power generation capacity in India (10.5%) and China (13.3%) outperformed other major economies. To meet the desired renewables generation capacity target of 11,000 GW, China and India must improve their current renewable power capacity growth by 40-80/% and the developed countries by 300%.
Energy intensity in the developed countries and India and China has been reducing at about 2% pa (Table 3). China’s energy intensity is high and requires steep reduction. Reducing energy intensity at 4% pa will require policy changes and financial investments.
India and China have little quarrel with the COP28 pledge’s recommendations to treble renewable power generation capacity and improve energy efficiency. By stretching themselves they can fulfil these recommendations. What vexes them is the pledge’s recommendation to phase down unabated coal power and end further investment in it.
India and China are among the top five major economies of the world (Table 4) and aspire to become developed countries in the coming decades. As there is a high correlation between energy use and GDP, India and China must use increasingly large amounts of energy to maintain their economic growth.
India and China have vast coal reserves and exploiting them is the easiest and most secure way to maintain a high growth rate. Thermal plants contribute the bulk of the power generated in India (77%) and China (65%) (Table 1). Their reluctance to sign a pledge to phase down unabated coal power stems from the growth trajectories they have chosen.
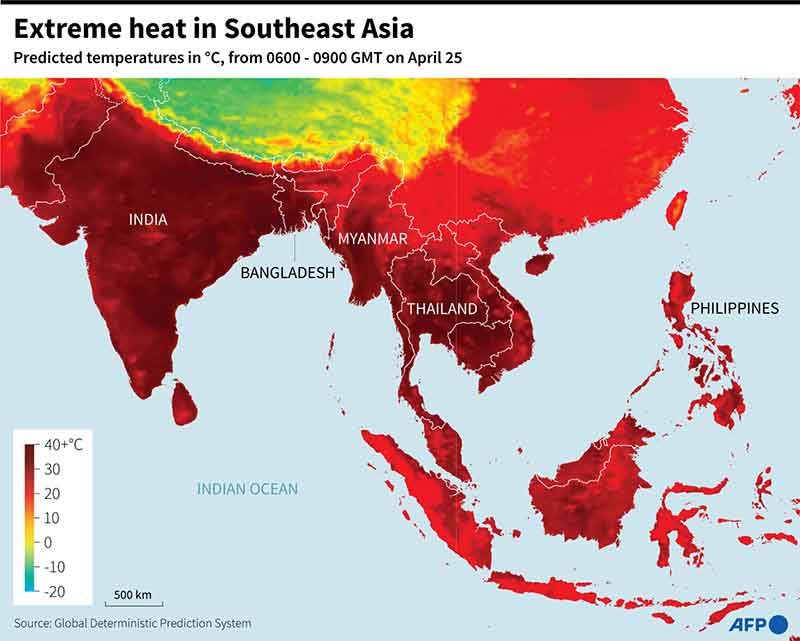
India and China’s pathways have serious climate change impacts. If these countries use unabated coal till their stated net carbon neutral dates in 2070 and 2060, respectively, they will cause a carbon emission overshoot unless other countries compensate by becoming net carbon-negative before 2050, the year that the world must become net carbon neutral to remain within a 1.5oC warming. But no major emitter country has committed to doing this. A significant carbon overshoot will warm the earth beyond the 1.5oC redline, making India one of the hardest climate-impacted regions in the world.
Since the Industrial Revolution began 300 years ago, European and North American countries powered their material development with fossil fuels and notched up a per capita cumulative emission[iv] of 1,200 tCO2. In contrast, India and China have per capita cumulative emissions of 42 and 178 tCO2, respectively. Even if the entire remaining carbon space[v] of about 100 GtCO2 to remain within a 1.5oC warming were given only to India and China, it would increase their per capita cumulative emissions to 78 and 214 tCO2, respectively. This is far short of the cumulative emissions (a good surrogate for the amount of fossil fuel used) required to achieve the material living standards of the developed countries. Additional renewable energy expected to come into line shortly is insufficient to propel India and China to join the ranks of the developed countries.
A fallout of India and China’s development policies, driven by the Trickledown theory, is the increase in inequality over the last four decades (Table 5). The income share of the top 10% of the population increased from 32% to 52%, and that of the bottom 50% dropped from 21% to 13%. China’s story is similar. Twenty-two per cent of India’s population is still below the poverty line. India and China’s reluctance to endorse the COP28 renewables pledge so that they may use fossil fuels to power faster growth will further exacerbate inequality. This has the potential to increase social conflict between the poor and the rich in these countries.
India is in a Catch-22 situation. If it continues to accelerate development by burning fossil fuels there are downsides—severe climate impacts, and increased inequality. And there is no guarantee that this will make India a developed country. On the other hand, if India reduced fossil fuel use, its high GDP growth rate would have to be sacrificed and consequently it would permanently lag behind the developed countries.
Intergovernmental meetings—COPs, G20, etc., have not helped India resolve its dilemma regarding how to develop sustainably. Indian stakeholders who will be impacted the most by climate change—working people, farmers and farm workers, Adivasis in forests, fisherfolk, and youth, along with other vulnerable sections of the world’s population, must form their platform to discuss programmes that can deliver climate justice, just transition, and global sustainability. They must determine benchmarks for the quantity of energy use, its mix and its distribution, and emissions allocation based on the principles of responsibility (cumulative historic emissions contributing to the climate problem), capacity to contribute to solutions (measured by financial resources above and beyond what is needed to sustain a modest but decent standard of living), and equity.
————————-
Tables
Table 1: Fossil fuel and renewable energy use and installed power generation capacity post the 1997 Kyoto Protocol
| Year | Power generation by fossil fuels | Power generation by renewables including hydro | Power generation by renewables excluding hydro | ||||
| (TWh) | (%) | (TWh) | (%) | (TWh) | (%) | ||
| World | 1997 | 8,911.34 | 64.22 | 2,574.14 | 18.55 | 12.78 | 0.001 |
| 2022 | 17,559.97 | 61.3 | 8,468.98 | 29.55 | 4,180.39 | 14.6 | |
| Europe + North America | 1997 | 4,884.72 | 58.16 | 1,609.82 | 19.05 | 191.97 | 2.29 |
| 2022 | 5,127.3 | 51.85 | 2,881.98 | 29.14 | 1,489.62 | 15.06 | |
| India | 1997 | 386.9 | 82,6 | 71.21 | 15.21 | 1 | 0.2 |
| 2022 | 1,430.92 | 77.01 | 380.87 | 20.5 | 205.95 | 11.08 | |
| China | 1997 | 922.23 | 81.4 | 196.58 | 17.35 | 0.6 | 0.05 |
| 2022 | 5,760.75 | 65.1 | 2,3507.07 | 26,64 | 1,047.58 | 12.23 | |
Source: Computed from data available at Our World in Data–Electricity mix
Table 2: Installed power generation capacity of renewable energy post the 2015 Paris Agreement
| Year | Installed power generation capacity of renewables including hydro | Installed power generation capacity of renewables excluding hydro | |||
| GW | CAGR 2015-2022 (% pa) | GW | CAGR 2015-2022 (% pa) | ||
| World | 2015 | 1,965.93 | 8.6% | 755.37 | 16% |
| 2022 | 3,518.89 | 2,126.35 | |||
| Europe + North America | 2015 | 821.68 | 6.1% | 413.18 | 10.3% |
| 2022 | 1,244.6 | 819.09 | |||
| India | 2015 | 83.37 | 10.5% | 36.26 | 18.1% |
| 2022 | 167.8 | 115.79 | |||
| China | 2015 | 502.13 | 13.3% | 182.6 | 23.4% |
| 2022 | 1,206.59 | 793.09 | |||
Source: Installed renewable power generation capacity computed from data available at IRENA—Regional trends
Table 3: Energy intensity reduction post the 1997 Kyoto Protocol
| Year | Energy use per US$ 1000 GDP | Reduction in energy use per US$ 1000 GDP per annum | |
| Constant 2017 PPP | CAGR 1997-2014 (% per annum) | ||
| World | 1997 | 150.9 | -1.3 |
| 2014 | 120.2 | ||
| Europe | 1997 | 108.9 | -2 |
| 2014 | 77.5 | ||
| North America | 1997 | 175.6 | -2.2 |
| 2014 | 120.1 | ||
| India | 1997 | 175.2 | -2.0 |
| 2014 | 124.4 | ||
| China | 1997 | 309.9 | -2.9 |
| 2014 | 187.7 |
Source: Energy intensity data–World Bank open data
Table 4: GDP and human development
| GDP | Per capita GDP | Average annual GDP growth rate | Human Development Index | |
| 2022 (US$ trill) | 2022 (US$) | 2010-22 (%) YoY | 2021 | |
| World | 100.56 | 12,647.5 | 2.9 | |
| European Union | 16.64 | 37,149.6 | 1.3 | >0.78 |
| North America | 27.61 | 74,164.7 | 2.1 | >0.92 |
| India | 3.34 | 2,388.6 | 5.9 | 0.633 |
| China | 17.96 | 12,720.2 | 6.9 | 0.768 |
Source: GDP data–World Bank open data, HDI—Human Development Report 2021/2022m
Table 5: Inequality in income shares between top 10% and bottom 50% of the population
| Income share of the top 10% of the population | Income share of the bottom 50% of the population | |||
| 1980 | 2022 | 1980 | 2022 | |
| World | 52.2 | 52.5 | 6.0 | 7.8 |
| European Union | 31.8 | 35.5 | 19.7 | 18.0 |
| North America | 33.5 | 45.6 | 19.7 | 13.3 |
| India | 32.4 | 57.1 | 20.6 | 12.7 |
| China | 27.9 | 43.4 | 24.2 | 13.1 |
Source: Income shares—World Inequality database
Sagar Dhara Male, Upper caste & class, University-educated, City slicker, Member of the most ferocious predator that ever stalked Earth—humans.
[ii] Energy efficiency implies using less energy to perform the same task. It is measured by comparing the amount of energy required to produce a given quantity of a product, e.g., MJ/kg steel, at different points of time or for different processes, or the amount of energy required for US$ 1,000 of GDP at different points of time or for different countries.
[iii] Unabated coal refers to coal produced and used without interventions that substantially reduce the amount of GHG emitted throughout the life cycle; for example, capturing 90% or more CO2 from power plants.
[iv] Per capita cumulative emissions are the total historic emissions of a nation from 1750 to date divided by the current population of the nation.
[v] Carbon space is the amount of CO2 that can still be emitted into the atmosphere to remain within a given warming, e.g., 1.5o or 2oC.