The reasons why the Green New Deal won’t really work are fairly subtle. A person really has to look into the details to see what goes wrong. In this post, I try to explain at least a few of the issues involved.
[1] None of the new renewables can easily be relied upon to produce enough energy in winter.
The world’s energy needs vary, depending on location. In locations near the poles, there will be a significant need for light and heat during the winter months. Energy needs will be relatively more equal throughout the year near the equator.
Solar energy is particularly a problem in winter. In northern latitudes, if utilities want to use solar energy to provide electricity in winter, they will likely need to build several times the amount of solar generation capacity required for summer to have enough electricity available for winter.
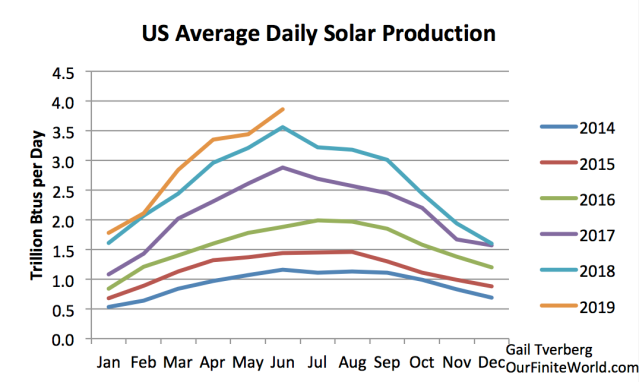
Figure 1. US daily average solar production, based on data of the US Energy Information Administration.
Hydroelectric tends to be a spring-dominated resource. Its quantity tends to vary significantly from year to year, making it difficult to count on.
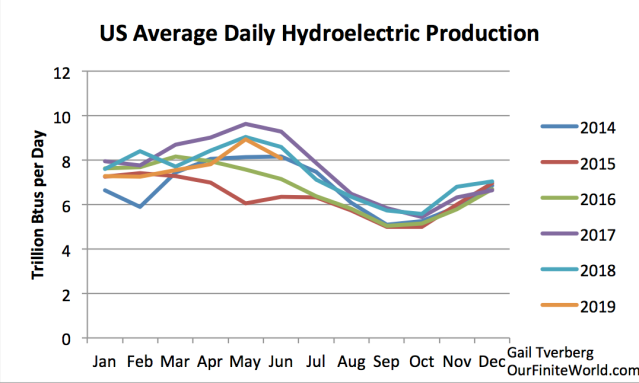
Figure 2. US daily average hydroelectric production, based on data of the US Energy Information Administration.
Another issue with hydroelectric is the fact that most suitable locations have already been developed. Even if additional hydroelectric might help with winter energy needs, adding more hydroelectric is often not an option.
Wind energy (Figure 3) comes closest to being suitable for matching the winter consumption needs of the economy. In at least some parts of the world, wind energy seems to continue at a reasonable level during winter.
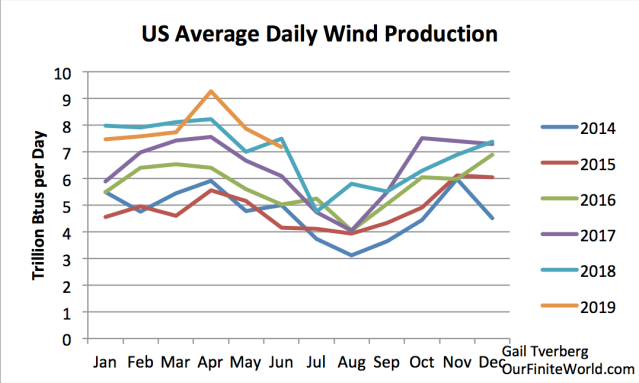
Figure 3. US daily average wind production, based on data of the US Energy Information Administration.
Unfortunately, wind tends to be quite variable from year to year and month to month. This makes it difficult to rely on without considerable overbuilding.
Wind energy is also very dependent upon the continuation of our current economy. With many moving parts, wind turbines need frequent replacement of parts. These parts need to be precisely correct, with virtually no tolerance for change. Sometimes, helicopters are needed to install the new parts. Because of the need for continued high-technology maintenance services, wind energy cannot be expected to continue to operate for very long unless the world economy, with all of its globalization, can continue pretty much as today.
[2] Depending upon burned biomass in winter is an option, but we already know that this path is likely to lead to massive deforestation.
Historically, people burned wood and other biomass to provide heat and light in winter. If biomass is burned for heat and light, it is an easy step to using charcoal for smelting metals for goods such as nails and shovels. But with today’s population of 7.7 billion people, the huge demand for biomass would quickly deforest the whole world. There is already a problem with growing deforestation, especially in tropical areas.
It is my understanding that the Green New Deal is focusing primarily on wind, hydroelectric, and solar rather than biomass, because of these issues.
[3] Battery backup for renewables is very expensive. Because of their high cost, batteries tend to be used only for very short time periods. At a 3-day storage level, batteries do nothing to smooth out season-to-season and year-to-year variation.
The cost of batteries is not simplytheir purchase price. There seem to be several related costs associated with the use of batteries:
- The initial cost of the batteries
- The cost of replacements, because batteries are typically not very long-lived compared to, say, solar panels
- The cost of recycling the battery components rather than simply leaving the batteries to pollute the nearby surroundings
- The loss of electric charge that occurs as the battery sits idle for a period of time and the loss related to electricity storage and retrieval
We can get some idea of the cost of batteries from an analysis by Roger Andrews of a Tesla/Solar City system installed on the island of Ta’u. The island is in American Samoa, near the equator. This island received a grant that was used to add solar panels, plus 3-day battery backup, to provide electricity for the tiny island. Any outages longer than the battery capacity would continue to be handled by a diesel generator. The goal was to reduce the quantity of diesel used, not to eliminate its use completely.
Based on Andrews’ analysis, adding a 3-day battery backup more than doubled the cost of the PV-alone system. (It added 1.6 times as much as the cost of the installed batteries.) The catch, as I pointed out above, is that the cost doesn’t stop with purchasing the initial batteries. At least one set of replacement batteries is likely to be needed during the lifetime of the system. And there are other costs that are more subtle and difficult to evaluate.
Furthermore, this analysis was for a solar system. There seems to be more variation over longer periods for wind. It is not clear that the relative amount of batteries would be enough for 3-day backup of a wind system, or for a combination of wind, hydroelectric and solar. The long-term cost of a solar panel plus battery system might easily come to four times the cost of a wind or solar system alone.
There is also the issue of necessary overbuilding to make the system work. On Ta’u, near the equator, with diesel power backup, the system is set up in such a way that 40% of the solar generation is in excess of the island’s day-to-day electricity consumption. This constitutes another cost of the system, over and above the cost of the 3-day battery backup.
If we also eliminate the diesel backup, then we start adding more costs because the level of overbuilding would need to be even higher. And, if we were to create a similar system in a location with substantial seasonal temperature variation, even more overbuilding would be required if enough capacity is to be made available to provide sufficient generation in winter.
[4] Even in sunny, warm California, it appears that substantial excess capacity needs to be added to avoid the problem of inadequate generation during the winter months, if the electrical system used is based on wind, hydroelectric, solar, and a 3-day backup battery.
Suppose that we want to replace California’s electricity consumption (excluding other energy, including oil products) with a new system using wind, hydro, solar, and 3-day battery backup. Current California renewable generation, compared to current consumption, is as shown on Figure 4, based on EIA data.
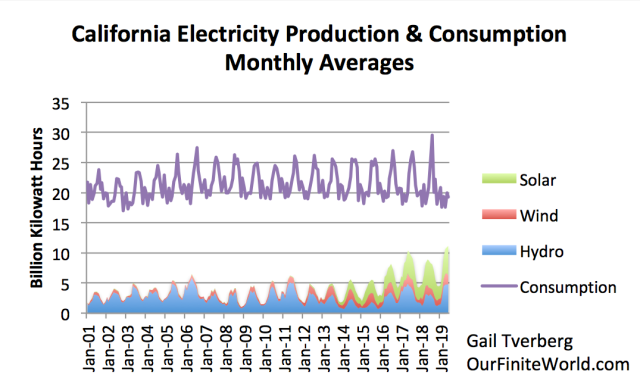
Figure 4. California total electricity consumption compared to the sum of California solar, wind, and hydroelectric production, on a monthly average basis. Data used from the US Energy Information Administration through June 30, 2019.
California’s electricity consumption peaks about August, presumably due to all of its air conditioning usage (Figure 5). This is two months after the June peak in the output of solar panels. Also, electricity usage doesn’t drop back nearly as much during winter as solar production does. (Compare Figures 1 and 5.)
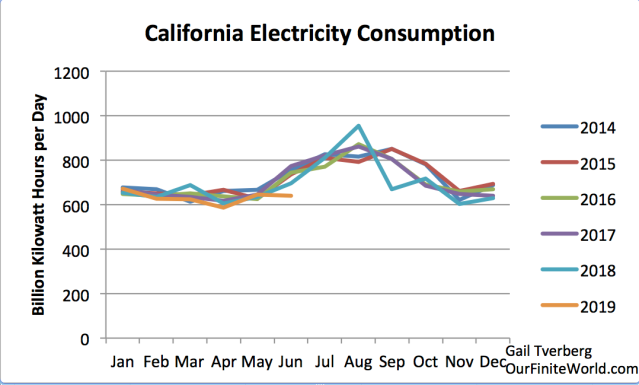
Figure 5. California electricity consumption by month, based on US Energy Information Administration data.
We note from Figure 4 that hydroelectric production is extremely variable. It appears that hydroelectric generation can vary by a factor of five comparing high years to low years. California hydroelectric generation uses all available rivers, so any new energy generation will need to come from wind and solar.
Even with 3-day backup batteries, we need the system to reliably produce enough electricity that it can meet the average electricity generation needs of each separate month. I did a rough estimate of how much wind and solar the system would need to add to bring total generation sufficiently high so as to prevent electricity problems during the winter. In making the analysis, I assumed that the proportion of added wind and solar would be similar to their relative proportions on June 30, 2019.
My analysis suggests that to reliably bridge the gap between production and consumption (see Figure 4), approximately six times as much wind and solar would need to be added (making 7 = 6 +1 times as much generation in total), as was in place on June 30 , 2019. With this arrangement, there would be a huge amount of wind and solar whose production would need to be curtailed during the summer months.
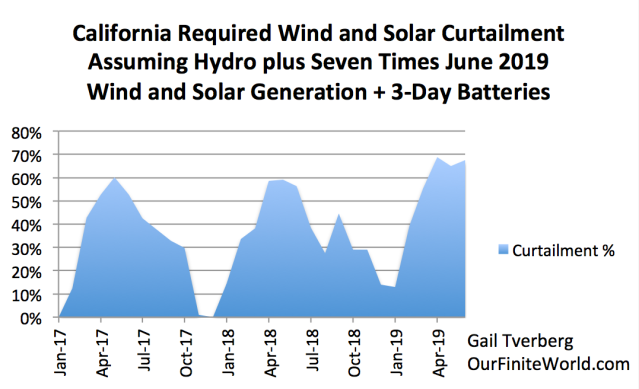
Figure 6. Estimated share of wind and solar production that would need to be curtailed, to provide adequate winter generation. The assumption is made that hydroelectric generation would not be curtailed.
Figure 6 shows the proportion of wind and solar output that would be in excess of the system’s expected consumption. Note that in winter, this drops to close to zero.
[5] None of the researchers studying the usefulness of wind and solar have understood the need for overbuilding, or alternatively, paying backup electricity providers adequately for their services. Instead, they have assumed that the only costs involved relate to the devices themselves, plus the inverters. This approach makes wind and intermittent solar appear far more helpful than they really are.
Wind and solar have been operating in almost a fantasy world. They have been given the subsidy of “going first.” If we change to a renewables-only system, this subsidy of going first disappears. Instead, the system needs to be hugely overbuilt to provide the 24/7/365 generation that backup electricity providers have made possible with either no compensation at all, or with far too little compensation. (This lack of adequate compensation for backup providers is causing problems for the current system, but it is beyond the scope of this article to discuss them here.)
Analysts have not understood that there are substantial costs that are not being reimbursed today, which allow wind and solar to have the subsidy of going first. For example, if natural gas is to be used as backup during winter, there will still need to be underground storage allowing natural gas to be stored for use in winter. There will also need to be pipelines that are not used much of the year. Workers will need to be paid year around if they are to continue to specialize in natural gas work. Annual costs of the natural gas system will not be greatly reduced simply because wind, hydro, and water can replace natural gas usage most months of the year.
Analysts of many types have issued reports indicating that wind and solar have “positive net energy” or other favorable characteristics. These favorable analyses would disappear if either (a) the necessary overbuilding of the system or (b) the real cost of backup services were properly recognized. This problem pervades studies of many types, including Levelized Cost of Energy studies, Energy Returned on Energy Invested studies, and Life Cycle Analyses.
This strange but necessary overbuilding situation also has implications for how much homeowners should be paid for their rooftop solar electricity. Once it is clear that only a small fraction of the electricity provided by the solar panels will actually be used (because it comes in the summer, and the system has been overbuilt in order to produce enough generation in winter), then payments to homeowners for electricity generated by rooftop systems will need to decrease dramatically.
A question arises regarding what to do with all of the electricity production that is in excess of the needs of customers. Many people would suggest using this excess electricity to make liquid fuels. The catch with this approach is that the liquid fuel needs to be very inexpensive to be affordable by consumers. We cannot expect consumers to be able to afford higher prices than they are currently paying for fossil fuel products. Also, the new liquid fuels ideally should power current devices. If consumers need to purchase new devices in order to utilize the new fuels, this further reduces the affordability of a planned changeover to a new fuel.
Alternatively, owners of solar panels might be encouraged to use the summer overproduction themselves. They might set the temperatures of their air conditioners to a lower setting or heat a swimming pool. It is unlikely that the excess could be profitably sold to nearby utilities because they are likely encounter the same problem in summer, if they are using a similar generation mix.
[6] As appealing as an all-electric economy would seem to be, the transition to such an economy can be expected to take 150 years, based on the speed of the transition since 1985.
Clearly, the economy uses a lot of energy products that are not electricity. We are familiar with oil products burned in many vehicles, for example. Oil is also used in many ways that do not require burning (for example, lubricating oils and asphalt). Natural gas and propane are used to heat homes and cook food, among other uses. Coal is sometimes burned in making pig iron and cement in China.

Figure 7. Electricity as a share of total energy use for selected areas, based on BP’s 2019 Statistical Review of World Energy.
Electricity’s share of total energy consumption has gradually been rising (Figure 7).* We can make a rough estimate of how quickly the changeover has been taking place since 1985. For the world as a whole, electricity consumption amounted to 43.4% of energy consumption in 2018, rising from 31.2% in 1985. On average, the increase has been 0.37%, over the 33-year period shown. If we assume this same linear growth pattern holds going forward, it will take 153 years (until 2171) until the world economy can operate using only electricity. This is not a quick change!
[7] While moving away from fossil fuels sounds appealing, pretty much everything in today’s economy is made and transported to its final destination using fossil fuels. If a mis-step takes place and leaves the world with too little total energy consumption, the world could be left without an operating financial system and with way too little food.
Over 80% of today’s energy consumption is from fossil fuels. In fact, the other types of energy shown on Figure 8 would not be possible without the use of fossil fuels.
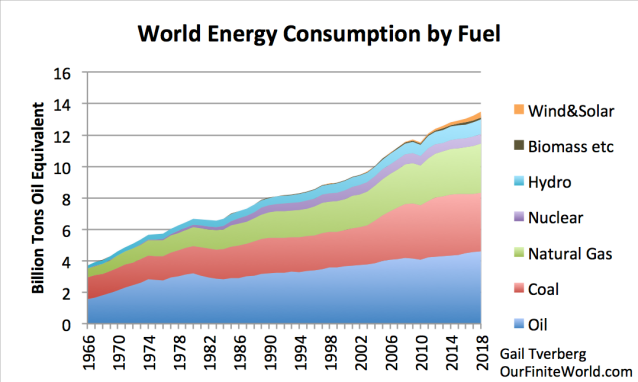
Figure 8. World Energy Consumption by Fuel, based on data of 2019 BP Statistical Review of World Energy.
With over 80% of energy consumption coming from fossil fuels, pretty much everything we have in our economy today is available thanks to fossil fuels. We wouldn’t have today’s homes, schools or grocery stores without fossil fuels. Even solar panels, wind turbines, batteries, and modern hydroelectric dams would not be possible without fossil fuels. In fact, for the foreseeable future, we cannot make any of these devices with electricity alone.
In Figure 8, the little notch in world energy consumption corresponds to the Great Recession of 2008-2009. The connection between low energy consumption and poor economic outcomes goes back to many earlier periods. Energy consumption growth was unusually low about the time of the Great Depression of the 1930s and about the time of the US Civil War. The vulnerability of the financial system and the possibility of major wars are two reasons why a person should be concerned about the possibility of an energy changeover that doesn’t provide the economic system with adequate energy to operate. The laws of physics require energy dissipation for essentially every activity that is part of GDP. Without adequate energy, an economy tends to collapse. Economists are generally not aware of this important point.
Agriculture is dependent upon fossil fuels, particularly oil. Petrochemicals are used directly to make herbicides, pesticides, medications for animals and nitrogen fertilizer. Huge quantities of energy are necessary to make metals of all kinds, such as the steel in agricultural equipment and in irrigation pumps. Refrigerated vehicles transport produce to market, using mostly oil-based fuel. If the transition does not go as favorably as hoped, food supplies could prove to be hopelessly inadequate.
[8] The scale of the transition to hydroelectric, wind, and solar would be unimaginably large.
Today, wind, hydroelectric, and solar amount to about 10% of world energy production. Hydroelectric amounts to about 7% of energy consumption, wind about 2%, and solar about 1%. This can be seen on Figure 8 above. A different way of seeing this same relationship is shown in Figure 9, below.

Figure 9. World hydroelectric, wind and solar production as share of world energy supply, based on BP’s 2019 Statistical Review of World Energy.
Figure 9 shows that hydroelectric power is pretty well maxed out, as a percentage of energy supply. This is especially the case in advanced economies. This means that any increases that are made in the future will likely have to come from wind and solar. If hydroelectric, wind and solar are together to produce 100% of the world’s energy supply, then wind and solar, which today comprise 3% of today’s energy supply, will need to ramp up to 93% of energy supply. This amounts to a 30-fold increase in wind and solar between 2018 and 2030, based on one version of the Green New Deal’s planned timing. We would need to be building wind and solar absolutely everywhere, very quickly, to accomplish this.
[9] Moving to electric vehicles (EVs) for private passenger autos is not likely to be as helpful as many people hope.
One issue is that it is possible to mandate the use of EVs, but if the automobiles cost more than citizens can afford, many citizens will simply stop buying cars at all. At least part of the worldwide reduction in automobile sales seems to be related to changes in rules that are intended to reduce auto emissions. The slowdown in auto sales is part of what is pushing the world into recession.
Another issue is that private passenger autos represent a smaller share of oil consumption than many people would expect. BP data indicate that 26% of worldwide oil consumption is gasoline. Gasoline powers the vast majority of the world’s private passenger automobiles today. While an oil savings of 26% would be good, there would still be a very long way to go.
One study of EV sales in Norway suggests that, with large subsidies, these cars are disproportionately sold to high-income families as a second vehicle. The new second vehicles are often used for commuting to work, when prior to the EV ownership, the owner had been taking public transportation. When this pattern is followed, the savings in oil use from the adoption of EVs becomes very small because building and transporting EVs also requires oil use.
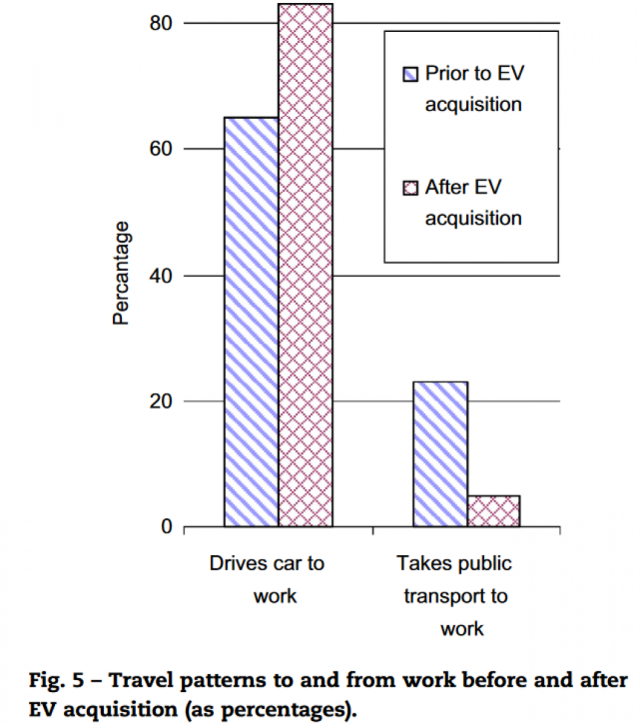
Figure 10. Source: Holtsmark and Skonhoft The Norwegian support and subsidy policy of electric cars. Should it be adopted by other countries?
If one of the goals of the Green New Deal is to level out differences between the rich and the poor, mandating EVs would seem to be a step in the wrong direction. It would make more sense to mandate walking or the use of pedal bicycles, rather than EVs.
[10] Wind, solar, and hydroelectric have pollution problems themselves.
With respect to solar panels, a major concern is that if the panels are broken (for example, by a storm or near the end of their lives), water alone can leach toxic substances into the water supply. Another issue is that recycling needs to be subsidized, to be economic. The price of solar panels needs to be surcharged at the front end, if adequate funds are to be collected to cover recycling costs. This is not being done in the US.
Wind turbines are better in terms of not being made of toxic substances, but they disturb bird, bat, and marine life in their vicinity. Humans also complain about their vibrations, if the devices are close to homes. The fiberglass blades of wind turbines are not recyclable, and many of them are too big to fit into standard crushing machines. They need to be chopped into pieces, in order to fit into landfills.
Adding huge amounts of 3-day battery backup for wind turbines and solar panels will create a new set of recycling issues. The extent of the recycling issues will depend on the battery materials used.
Of course, if we try to ramp up wind and solar by a huge factor, pollution problems will rise accordingly. The chance that raw materials will prove to be scarce will increase as well.
There will also be an increasing problem with finding suitable sites to install all of the devices and batteries. There are limits on how densely wind turbines can be spaced before the output of one wind turbine interferes with the output of other nearby turbines. This problem is not too different from the problem of declining per-well oil production caused by too closely spaced shale wells.
Afterword
I could explain further, but that would make this make this post too long. For example, using an overbuilt renewables system, there is not enough net energy to provide the high salaries almost everyone would like to see.
Also, the new renewable energy systems are likely to be more local than many have hoped. For example, I think it is highly unlikely that the people of North Africa would allow contractors to build a solar system in North Africa for the benefit of Europeans.
Note
*There are two different ways of comparing electricity’s value to that of total energy. Figure 7 uses the more generous approach. In it, the value of electricity is based on the amount of fossil fuels that would need to be burned to produce the electricity amounts shown. In the case of electricity types that do not involve burning of fossil fuels, these amounts are estimated amounts. The less generous approach compares the heat value of the electricity produced to the total heat value of primary energy sources. Using the less generous approach, electricity corresponds to only about 20% of primary energy supply. The transition to an all-electric economy would be much farther away using the heat value approach.
Gail E. Tverberg graduated from St. Olaf College in Northfield, Minnesota in 1968 with a B.S. in Mathematics. She received a M.S. in Mathematics from the University of Illinois, Chicago in 1970. Ms. Tverberg is a Fellow of the Casualty Actuarial Society and a Member of the American Academy of Actuaries. Ms. Tverberg began writing articles on finite world issues in early 2006. Since March 1, 2007, Ms. Tverberg has been working for Tverberg Actuarial Services on finite world issues. Her blog is http://ourfiniteworld.com
SIGN UP FOR COUNTERCURRENTS DAILY NEWS LETTER


