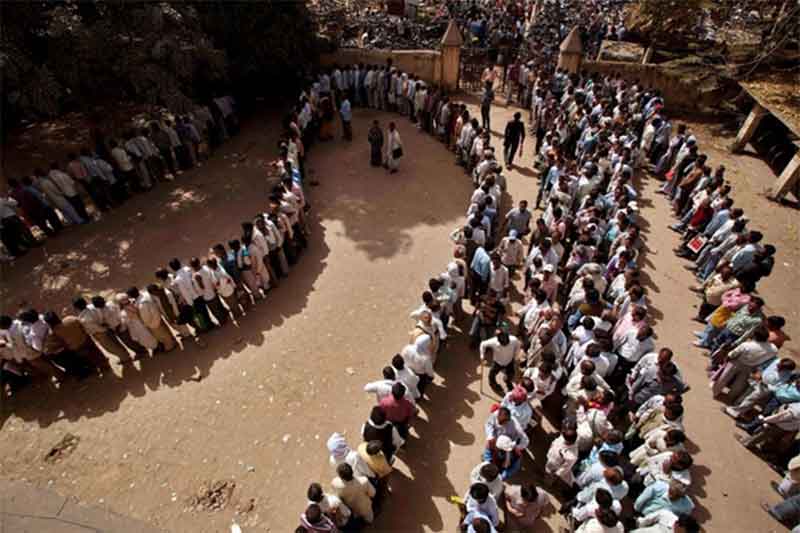
In this second part of our review of the economic situation of the country in early 2024, we take a look at the unprecedented unemployment crisis gripping the country.
Deepening Unemployment Crisis
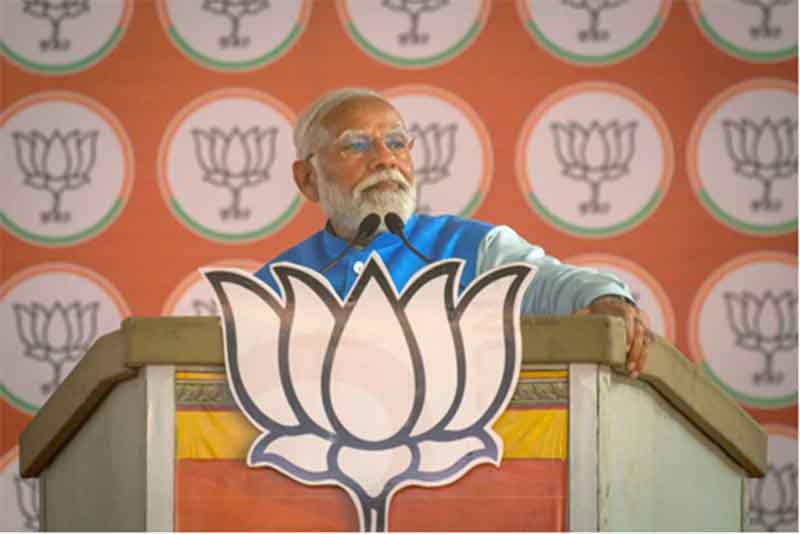
The Modi Government is in denial about the unemployment crisis. The Finance Minister’s budget speech does not even mention the word ‘unemployment’, and only says that various measures taken by the government have generated huge employment opportunities. And the Review of the Indian economy published by the Finance Ministry in lieu of the Economic Survey claims a significant decline in the unemployment rate:
- the Periodic Labour Force Surveys (PLFS) by the NSO estimate that the unemployment rate (UR) has declined substantially from 6% in 2017–18 to 3.2% in 2022–23;
- the Labour Force Participation Rate (LFPR) has increased from 49.8% in 2017–18 to 57.9% in 2022–23 [LFPR is the percentage of working-age population engaged in work or making tangible efforts to seek ‘work’.];
- youth (age 15–29 years) unemployment rate has declined from 17.8% in 2017–18 to 10% in 2022–23, while youth LFPR has expanded from 38.2% to 44.5% over the same period;
- the Worker Participation Rate (WPR) for youth (age 15–29 years) has increased from 31.4% in 2017–18 to 40.1% in 2022–23, implying that an additional 35 million people have found work, even though the population in that segment has increased only by 17 million [WPR, also called the employment rate, is the total number of people employed as a percentage of the working age population].
The figures put out by the Review are based on Periodic Labour Force Survey (PLFS) data released by the National Sample Survey Office (NSSO). PLFS collects data in two ways — Usual Principal and Subsidiary Status (UPSS) and Current Weekly Status (CWS). Under UPSS, the survey respondent has to recall their employment details from the last one year — if the person has been engaged in an economic activity for at least 30 days in the previous year, they are considered to be employed. In the CWS, the respondent has to recall the details over the past one week — an individual is counted as being employed if they have worked for at least one hour on at least one day during the seven days preceding the date of survey. While both the definitions have their limitations, the data based on CWS are considered to be more reliable because the recall is better over the past week. However, the above figures given by the Review are based on UPSS, probably because the UPSS unemployment rate is much lower than the CWS unemployment rate (see Table 2 for both UPSS and CWS data).
The biggest problem with the PLFS data is its reliability. The Modi Government’s frequent interference in the country’s statistical system, frequent changes in methodology of the surveys, suppression and delay in release of data — all have put the credibility of NSSO data under a cloud. Here is a brief history of the Modi Government’s interference in the country’s unemployment statistics.
During the first term of the Modi Government, in September 2016, data from the fifth round of the Annual Employment–Unemployment Survey (EUS) was released. This report showed that unemployment rate in India had gone up to a five-year high of 5% in 2015–16. The government panicked, and not only scrapped all subsequent Annual EU Surveys, but also the quinquennial Employment–Unemployment Survey conducted by the NSSO — whose next round was due in 2016–17. This survey on employment and unemployment had been conducted regularly every five years since 1972–73 in rural and urban areas, and provided extensive information about the volume and structure of employment and unemployment in the country, and also several other indicators related to the quality of workers and non-workers.
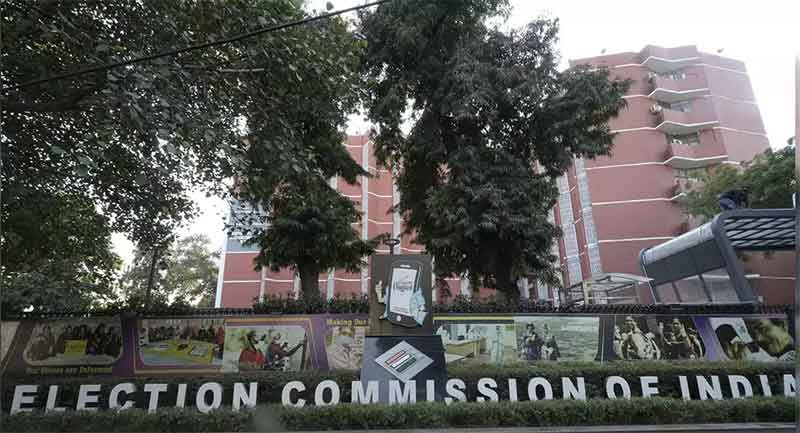
Consequent to the scrapping of these surveys, the government released no official data on the unemployment situation in the country for the next three years. Subsequently, in 2017, it instituted another employment survey, the PLFS, to be done by the NSSO. This survey was conducted between July 2017 and June 2018. But with Lok Sabha elections coming, the Modi Government decided to withhold the release of this data too. It did so despite the National Statistical Commission (NSC) — the apex body that coordinates India’s statistical activities — approving its release. The NSC is an autonomous body; the government is not supposed to interfere in its functioning. In protest, on 28 January 2019, the last two independent members of the NSC, one of whom was also the acting chairman, resigned.[1]
Finally, after the 2019 Lok Sabha elections were done and dusted with, the government released the suppressed PLFS data. It showed that joblessness was at a 45-year high of 6.1% in 2017–18 (the Centre has been collecting unemployment data since the early 1970s). Worse, the data showed that instead of creation of more jobs, the total number of jobs in the economy had actually fallen during the period 2012 to 2018 — from 47.42 crore in 2011–12 to 46.51 crore in 2017–18 (Table 1).[2] It is the first time this has happened since independence.
Table 1: Total Employment, 2012 to 2018 (in crore)
| Total Employment | |
| 2011–12 | 47.4 |
| 2017–18 | 46.5 |
In all probability, the Modi Government now tweaked the data collection methodology. This suspicion arises because even though the country’s GDP growth rate has been slowing down since 2017–18, data put out by subsequent PLFS surveys show a secular increase in the LFPR and a decline in the unemployment rate (UR) between 2017–18 and 2022–23 (Table 2)! PLFS data also show that both the LFPR and WPR have been increasing — which means that this decrease in unemployment rate has not occurred because of an increase in discouraged workers (who drop out of the labour force because they cannot find work), but because the economy has been creating more jobs. So, the PLFS data imply that despite the economy sinking into recession, employment generation is robust!
Table 2: LFPR, WPR and UR for All Workers Above 15 years (in %) [3]
| Usual Status | Current Weekly Status | GDP Growth Rate (%) | |||||||
| WPR | LFPR | UR | WPR | LFPR | UR | ||||
| 2017–18 | 46.8 | 49.8 | 6.0 | 44.1 | 48.4 | 8.7 | 6.8 | ||
| 2018–19 | 47.3 | 50.2 | 5.8 | 44.3 | 48.5 | 8.7 | 6.5 | ||
| 2019–20 | 50.9 | 53.5 | 4.8 | 46.7 | 51.2 | 8.8 | 3.9 | ||
| 2020–21 | 52.6 | 54.9 | 4.2 | 47.9 | 51.8 | 7.5 | –5.8 | ||
| 2021–22 | 52.9 | 55.2 | 4.1 | 48.3 | 51.7 | 6.6 | 9.7 | ||
| 2022–23 | 56.0 | 57.9 | 3.2 | 51.8 | 54.6 | 5.1 | 7.0 | ||
What is even more incredulous is that the PLFS data show a decline in unemployment and an increase in LFPR and WPR even during the pandemic year 2020–21, a year when official figures admit that the economy contracted by 5.8% — and Professor Arun Kumar estimates that it actually contracted by –29% due to the total collapse of the informal sector (which is not taken into consideration in official data).[4] This implies that the economy created more jobs during the pandemic year 2020–21 as compared to the pre-pandemic year! In their enthusiastic massaging of survey data, the government’s spin doctors probably forgot that the data must show at least some increase in unemployment during the pandemic year for the data to have some credibility.
Basing itself on PLFS data, the State of Working India 2023 report of Azim Premji University estimates the total number of unemployed in the country to be 3.5 crore (on CWS basis) in 2021–22 (see Table 3).[5] And on UPSS basis, the number of unemployed falls to just 2.3 crore.
Table 3: Key Labour Market Indicators (based on CWS, in million)
| 2017–18 | 2018–19 | 2019–20 | 2020–21 | 2021–22 | |
| Working age population | 968 | 985 | 1000 | 1022 | 1021 |
| Labour force | 468 | 478 | 512 | 525 | 528 |
| Workforce | 427 | 436 | 467 | 486 | 493 |
| Unemployed | 41 | 42 | 45 | 39 | 35 |
| Out of labour force | 500 | 508 | 488 | 489 | 493 |
Facts on the ground belie Modi Government’s claims. Just two years ago, in 2022, there were job riots twice within the space of six months in UP and Bihar — first over delay and irregularities in the railway recruitment examination, and then against the Agnipath scheme. These riots were clearly a reflection of youth anger against the worsening unemployment situation. The severity of the unemployment situation in the country is also revealed in a reply given in Parliament by the Minister of State in the Ministry of Personnel, Public Grievances and Pensions on 27 July 2022. The minister stated that between 2014 and 2022, a staggering 22.06 crore applications for jobs were received by the Central government, of which 7.22 lakh persons were recruited. According to data provided by the minister, in 2020–21, 1.8 crore persons applied for jobs with the Central government, while 78,000 recruitments were made, and in 2021–22, 1.87 crore applications were received and 38,000 recruitments made.[6] Yet PLFS unemployment data shows that only 2.3 crore people were unemployed in 2021–22!
In June 2022, about 17 lakh people applied for 3,400 jobs requiring a minimum qualification of Class 10 in the developed state of Gujarat.[7] In end-2022, the Maharashtra police received more than 11 lakh applications for 18,300 posts of constables and drivers. In mid-2023, the state received more than 11.5 lakh applications for 4,600 posts of Talathi, a Group C post.[8] And in UP, the Staff Selection Commission’s (SSC) MTS 2023 recruitment examination for Group D jobs (peon, watchman, gardener, etc.) saw a staggering 55 lakh people apply for 11,400 jobs. This is more than double the number of applications received for the previous exam in 2022 — another clear indicator of the rapidly worsening employment situation. While the minimum educational requirement was only a high school diploma, candidates with much higher qualifications, such as BTech, MTech, BBA, MBA, and MSc degrees applied for these jobs.[9]
These facts unequivocally show that there has been no decline in the unemployment crisis in the post-Covid years as claimed by the PLFS data. The country’s official statisticians have indulged in statistical jugglery to paint a rosy picture of the employment situation. In this article, we attempt to probe into PLFS data to find out what is actually happening on the jobs front in the country. But before that, let us briefly take a look at another reputed dataset, that is increasingly being relied upon by economists and policy researchers because of the suppression of key economic data by the Modi Government.
CMIE Data on Unemployment
Another important data source about the employment and unemployment situation in India is the household survey data put out by the CMIE (Centre for Monitoring Indian Economy, a leading private business information company). Table 4 gives the unemployment rate in the country according to the CMIE (we have calculated the yearly figures by averaging the monthly unemployment rate given out by the CMIE).
These unemployment figures are clearly closer to reality. The UR which was 4.6% in 2017–18, rose to 6.3% in 2018–19. It shot up to 10% during the year the country was hit by the pandemic. The marginal recovery from the economic collapse (as discussed in Part 1 of this article) has led to a slight decline in the UR, but unemployment continues to be higher than before the pandemic. Not only that, the UR has once again started increasing in FY24 — it increased to 8.1% in 2023–24, significantly higher than the UR of 7.6% in 2019–20.
Table 4: UR, 2017–18 to 2023–24 (CMIE data) (in %)
| 2017–18 | 2018–19 | 2019–20 | 2020–21 | 2021–22 | 2022–23 | 2023–24 | |
| Unemployment Rate | 4.6 | 6.3 | 7.6 | 10 | 8 | 7.6 | 8.1 |
This means that the recovery has occurred primarily in sectors and activities which are not employment-intensive; implying that the employment intensive petty and small-scale sectors have been left out of the ambit of the recovery. This is precisely what we have pointed out in Part 1 of this article series, where we have discussed the problems with the country’s high post-pandemic GDP growth rate data.
Estimating the Actual Unemployment Rate in India
Good data or bad data, data always reveals a lot. A deep dive into PLFS data reveals several problems with the data collection methodology of PLFS, because of which the employment data derived from it become so ludicrous.
i) The Category of Unpaid Workers
The government has been trying to discredit the CMIE data, claiming that the surveys of such private organisations are “generally neither scientific nor based on internationally accepted norms”.[10] Whereas the fact is: the CMIE sample is actually larger than that of NSO’s PLFS; and it covers both the organised an unorganised sectors, and both rural and urban areas. Not only that, the CMIE data is better, because the CMIE data uses internationally compliant definitions, which PLFS does not! The NSSO / PLFS data collection methodology regards unpaid family labour as employment. In the PLFS data, within the category of self-employment, there is a special category called “unpaid helper in family enterprises”. India is perhaps the only country in the world that includes such workers in employment data. As per the definition of the International Labour Organisation (ILO), which is followed by all countries of the world but not India, employment covers only that part of work which is remunerated. Therefore, unpaid work of any kind, whether in the family enterprise or within households in care and other activities, is considered to be work but NOT employment. Yet in India, the official data include this category in the workforce. The CMIE data too does not include such workers in the category of employed.[11]
Let us go back to the PLFS data, rework it on the basis of “internationally accepted norms”, and calculate the unemployment rates after excluding the “unpaid workers” from the category of employed.
For this, we disaggregate the PLFS data for the period 2017–18 to 2022–23 by type of employment: self-employment, regular paid or salaried work, and casual labour. This is done in Table 5 for all workers of all ages, in UPSS. For comparison, we also give the data for CWS for 2017–18 and 2022–23.
Table 5: Percentage Distribution of Workers by Status in Employment
(All ages, UPSS and CWS data)
| UPSS data | ||||||
| Self-employed | Regular wage | Casual labour | Total | |||
| Own-account | Unpaid Helper | Total | ||||
| 2017–18 | 38.6 | 13.6 | 52.2 | 22.8 | 24.9 | 100 |
| 2018–19 | 38.8 | 13.3 | 52.1 | 23.8 | 24.1 | 100 |
| 2019–20 | 37.6 | 15.9 | 53.5 | 22.9 | 23.6 | 100 |
| 2020–21 | 38.2 | 17.3 | 55.6 | 21.1 | 23.3 | 100 |
| 2021–22 | 38.3 | 17.5 | 55.8 | 21.5 | 22.7 | 100 |
| 2022–23 | 39 | 18.3 | 57.3 | 20.9 | 21.8 | 100 |
| CWS data | ||||||
| 2017–18 | 38.4 | 12.1 | 51.9 | 24.1 | 24 | 100 |
| 2022–23 | 39.9 | 15.6 | 56.6 | 22.3 | 21.2 | 100 |
As we can see in Table 5, the unpaid self-employed have increased — from 13.6% of all workers to 18.3% over the six-year period 2017–18 to 2022–23. The CWS data too show a similar increase.
This increase in the unpaid workers working in family enterprises only reflects an inability to find paid jobs. It confirms our analysis made in Part 1 of this article series that the post-pandemic economic recovery only reflects recovery in the organised sector; the unorganised sector continues to be in crisis.
As per the internationally accepted ILO definition, all these unpaid workers should be included in the unemployed, not in the employed. We calculate the Actual WPR and Actual UR in Table 6, after excluding the unpaid workers from the category of employed and including them in the unemployed.
As can be seen from Table 6, for 2022–23, the WPR drastically falls, from 41.1% to just 33.6% (and for CWS, from 38% to 32.1%). This is only to be expected, as the WPR had got inflated due to the addition of unpaid workers in it. Note that this actual WPR figure broadly matches WPR figures from CMIE data. As per CMIE data, the WPR for 2022–23 was 36.6%.
And the actual unemployment rate for 2022–23 shoots up to 20.7% for all workers (see Table 2). This is six times the official PLFS unemployment rate as per UPSS (3.2%). The CWS data also shows a very similar unemployment rate for 2022–23 (19.8%).
Table 6: Actual WPR and UR for All Workers, All Ages (UPSS data, in %)
| Official WPR | Actual WPR | LFPR | Actual UR | |
| 2017–18 | 34.7 | 30 | 36.9 | 18.7 |
| 2018–19 | 35.3 | 30.6 | 37.5 | 18.4 |
| 2019–20 | 38.2 | 32.1 | 40.1 | 20 |
| 2020–21 | 39.8 | 32.9 | 41.6 | 20.9 |
| 2021–22 | 39.6 | 32.7 | 41.3 | 20.8 |
| 2022–23 | 41.1 | 33.6 | 42.4 | 20.7 |
| CWS data | ||||
| 2022–23 | 38 | 32.1 | 40 | 19.8 |
From this, we can calculate that the total unemployed in the country is not 2.3 crore as claimed by the Modi Government, but 14.9 crore.
ii) The Underemployed Workers
The reworked data in Table 6 shows that unemployment rate for all workers only marginally increased during the pandemic year 2020–21, by just 0.9 percentage points. Whereas all ground reports suggest that the unorganised sector suffered a terrible collapse during the lockdown, probably by as much as 70–80% during Q1 2021.[12] Subsequently, after the lockdown was gradually lifted, the unorganised sector struggled to recover due to the government’s callous handling of the lockdown — the total relief package announced by the Modi Government was amongst the lowest in the world.[13] The renowned economist Professor Arun Kumar estimates that for the full financial year 2020–21, the economy probably suffered a contraction of –29%, with the unorganised sector suffering a contraction of much more than this. The unorganised sector accounts for 94% of the total employment — its sharp decline must have led to crores of people losing their livelihoods. Then why has unemployment for FY21 increased by only 0.9 percentage points, even in the reworked data?
In Table 7, we have calculated the percentage distribution of all workers by status of employment, after shifting the category of unpaid self-employed workers to unemployed. As can be seen from the table, nearly 50% of all workers are self-employed, and their percentage has increased over the period 2017–18 to 2022–23 by 3 percentage points. And casual workers account for a quarter of all workers.
Table 7: Percentage Distribution of Workers by Status in Employment
after Excluding Unpaid Workers (UPSS data)
| Self-employed, Own-account | Regular wage | Casual labour | Total | |
| 2017–18 | 44.7 | 26.4 | 28.9 | 100 |
| 2018–19 | 44.8 | 27.5 | 27.8 | 100 |
| 2019–20 | 44.7 | 27.2 | 28.1 | 100 |
| 2020–21 | 46.2 | 25.5 | 28.2 | 100 |
| 2021–22 | 46.4 | 26.1 | 27.5 | 100 |
| 2022–23 | 47.7 | 25.6 | 26.7 | 100 |
A closer examination of this data reveals another important problem in the PLFS data collection methodology, because of which the data does not reflect the huge increase in unemployment during the pandemic year 2020–21.
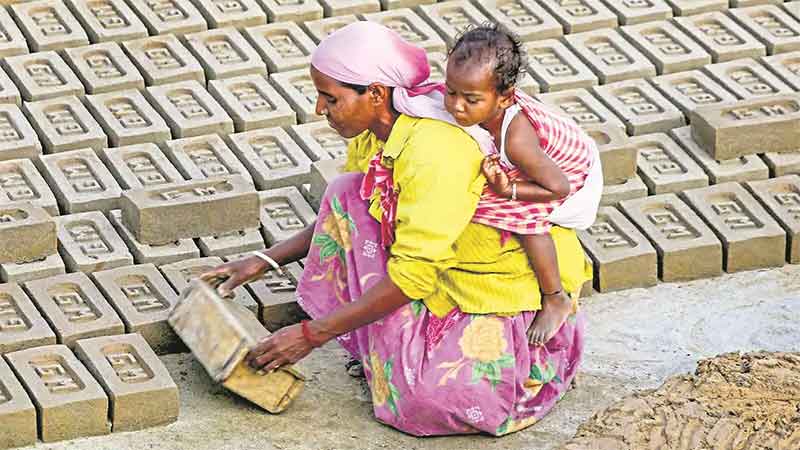
The overwhelming majority of the casual workers work in insecure low-paid jobs with no social security, like in the construction sector or in roadside eateries or in tiny enterprises. PLFS data give the average earnings of casual workers. Table 8 gives the real earnings of workers, after making adjustments for inflation using CPI. The data shows that the real wages of casual workers have increased by a mere 2.6% over the period 2017–18 to 2022–23. Even after this increase, the real wages in 2022–23 were only Rs 7,899. The India Employment Report 2024 of the ILO gives the distribution of casual workers by monthly wages on the basis of PLFS data and estimates that 78% of the casual workers earn less than Rs 7,500 per month.[14] How do people survive on a daily wage of Rs 250 per month!
As regards the self-employed workers, in most cases, self-employment reflects the absence of not just good quality paid employment, but any kind of paid employment. People selling idlis or pani-puris by the roadside, people selling fruits and vegetables on handcarts from morning 7 am to 9 pm in the night, rickshaw pullers and auto-rickshaw drivers — most of all these self-employed people do these jobs because of the absence of any kind of paid employment. None of these jobs have any kind of social security, no accident insurance, they often have to pay bribes to the local police, etc. Many even do not get free rations under the National Food Security Act. PLFS data on earnings of self-employed workers (Table 8) shows that real wages for these workers had started declining even before the Covid-19 pandemic. As is to be expected, they then fell sharply during the pandemic. The post-pandemic recovery led to some rise in wages, but the increase has been so anaemic that average real wages in 2021–22 were below 2017–18. It is only in 2022–23 that they crossed the pre-pandemic levels.
Table 8: Average Real Monthly Wage / Salary Earnings of Workers
Estimated from PLFS Various Rounds (in Rs, CWS data) [15]
| 2017–18 | 2018–19 | 2019–20 | 2020–21 | 2021–22 | 2022–23 | |
| Self-employment | 12,318 | 12,988 | 11,560 | 11,411 | 12,089 | 13,347 |
| Casual wage | 6,959 | 7,209 | 7,324 | 7,431 | 7,856 | 7,899 |
| Regular wage | 19,450 | 19,690 | 18,907 | 19,074 | 19,456 | 20,039 |
Despite falling real wages, the percentage of people in self-employment increased over the period 2017–18 to 2021–22. Why? Because there are no jobs.
In 1973–74, India’s Planning Commission defined the poverty line as that particular level of total spending per capita on all goods and services, whose food spending part satisfied the nutrition level of 2200 calories of energy intake per day in rural India, and 2100 per day in urban areas. It applied this definition to NSS data for 1973–74, and estimated the poverty line to be Rs 49/56 per day for rural/urban families. Since then, all kinds of subterfuges have been adopted by the government to change this definition and show a decline in poverty. But if we stick to this sensible definition of the poverty line, and use the NSS data for 2017–18 to estimate the per capita expenditure level at which exactly 2200 calories were accessed in rural India, then that works out to Rs 70 in 2017–18, or Rs 8,400 for a family of four. Updating it to 2022–23 (using the Agricultural Labourers Price Index), the poverty line works out to Rs 10,981 per month.[16]
What is astounding is that the average wage of the casual workers in 2022–23 is 30% less than this poverty line. [This poverty line is for a family of four. But since more than 80% of the female workforce in India is not engaged in any paid economic activity (see below), we can take the data in Table 8 to represent household income too for most families.] This means that the overwhelming majority of casual workers are living in penury. And the average wage of the self-employed workers is just 22% above this poverty line, which means a huge number of self-employed workers must also be living on the edges of destitution.
Nearly 50% of the workforce earns barely enough to eke out a living. Why do people work in such low-paying insecure jobs? Because there is no unemployment allowance in the country. So people have the option of either starving, or taking up whatever jobs are available, doing any kind of work, to somehow earn something and stay alive.
All unemployment surveys in India, be it the NSSO surveys or the CMIE surveys, consider all these workers in the informal sector to be ‘gainfully employed’, even if they are earning subsistence level wages. The reason why the PLFS data shows such a marginal increase in unemployment in 2020–21 is because with the government giving only a paltry relief package, people were trying to do something or the other to somehow stay alive. By PLFS definition, all these people are included in the “employed” category.
Defining all such people as “employed” is actually ridiculous; they are all victims of an economy that is unable to create decent jobs. Any humane society would consider them to be unemployed, or at least under-employed. International covenants such as ‘The International Covenant on Economic, Social and Cultural Rights’, and our own Constitution explicitly state that all workers have a right to a decent job that ensures them and their families a life of dignity. In 2015, the United Nations passed a landmark resolution announcing seventeen Sustainable Development Goals. One of these goals was providing “decent work for all”. The International Labour Organisation (ILO) in fact says that only those who are doing “decent” jobs should be considered as employed. The ILO defines “decent work” as work that delivers a fair income, security in the workplace and social protection for all, freedom for people to express their concerns (in plainer language, this means workers must have right to form trade unions and engage in collective bargaining), and equality of opportunity and treatment for all women and men.[17] This means that all workers whose earnings are able to provide them only the bare necessities of life should be recognised as ‘under-employed’, and included in the unemployed.
If we include the underemployed in the total number of unemployed in the country, the unemployment rate would go from the 20% estimated above to at least 50%, if not more! Terrible figures indeed.
But as we see below, even these mind-boggling unemployment figures are an underestimate!
iii) Discouraged Workers
A third problem with PLFS data becomes evident if we examine the Labour Force Participation Rate. It reveals that despite the inclusion of so many unpaid workers, the LFPR in India is only 54.6% on CWS basis and slightly higher at 57.9% on UPSS basis in 2022–23.
This figure is significantly less than that for other countries. The LFPR for high-income countries is 74.6%, nearly 20 percentage points more; for middle-income countries, it is 64.7%; for low-income countries, it is 66%; even for sub-Saharan Africa, it is 67.6%. For other emerging market countries whom India considers as its peers, the LFPR is 68.4% for Argentina, 70.3% for Brazil and 65.4% for Mexico. The world average is 66.3%.[18]
The reason why India’s LFPR is so low is because of the country’s terrible unemployment crisis, that has only been getting worse during the Modi years. There are simply no jobs. Consequently, many workers have simply given up looking for jobs out of frustration — because they have not been able to find a job for a long time. In official parlance, they are known as “discouraged workers”; such workers are not included in the official figures of the unemployed, nor are they included in the labour force.
But actually they should be included in both, as they have not dropped out of the labour force willingly, but due to frustration! Any pro-people system oriented towards providing decent jobs to all its people would seek to bring these workers back into the labour force.
Discouraged workers are there in all capitalist countries, due to the chronic nature of unemployment in capitalism. For instance, in the USA, while the total labour force was around 163 million in 2019, the discouraged workers totalled 10.22 million.[19] In India, the number of discouraged workers is much larger, as the unemployment situation is terrible. The number of discouraged workers in India above the global average can be estimated by comparing the LFPR in India with the global average – the LFPR in India is less than the global average by around 10 percentage points. That means the number of discouraged workers in India (above the global average) is at least 5.3 crore.[20]
Including the discouraged workers in the labour force and unemployed would send the Unemployment Rate through the roof! India’s unemployment crisis is among the worst in the world.
Women’s Employment
The godi media went ga-ga when the latest PLFS figures were released, as they showed that women’s employment, that has historically been very low in India, had actually increased during the Modi years, and the female unemployment rate had fallen to just 2.9% in 2022–23 (UPSS data) — it was even lower than that for men (3.3%) (see Table 10)! The data also showed that WPR for women has significantly increased — by as much as 14 percentage points..
Table 10: LFPR, WPR and UR for All Women Workers Above 15 years (in %)
| Usual Status | Current Weekly Status | GDP Growth Rate (%) | |||||||
| WPR | LFPR | UR | WPR | LFPR | UR | ||||
| 2017–18 | 22.0 | 23.3 | 5.6 | 19.2 | 21.1 | 9.0 | 6.8 | ||
| 2018–19 | 23.3 | 24.5 | 5.1 | 19.8 | 21.6 | 8.7 | 6.5 | ||
| 2019–20 | 28.7 | 30.0 | 4.2 | 24.4 | 26.3 | 7.3 | 3.9 | ||
| 2020–21 | 31.4 | 32.5 | 3.5 | 25.7 | 27.5 | 6.6 | –5.8 | ||
| 2021–22 | 31.7 | 32.8 | 3.3 | 25.6 | 27.2 | 5.8 | 9.7 | ||
| 2022–23 | 35.9 | 37.0 | 2.9 | 30.0 | 31.6 | 5.1 | 7.0 | ||
At the same time, PLFS earnings data also reveal a huge gender gap in earnings. Table 11 gives the average monthly earnings by gender for the three categories of employment for 2021–22. The starkest difference is seen in self-employment with women reporting earnings only 40% that of men.
Table 11: Gender Gap in Earnings for Different Kinds of Employment, 2021–22 [21]
| Self-employed (Rs per month) | Regular wage (Rs per month) | Casual wage (Rs per day) | |
| Women | 4,809 | 13,666 | 230 |
| Men | 12,099 | 17,910 | 358 |
| Ratio | 0.40 | 0.76 | 0.64 |
A deeper scrutiny of the data reveals that the employment situation for women is quite different from that portrayed in Table 10. In Table 12, we have given disaggregated data on the basis of employment status. The data reveals that two-thirds of the women were self-employed, and self-employed women workers as a percentage of total women workers had increased by more than 13 percentage points over the 6-year period 2017–18 to 2022–23. And even within self-employed women workers, more than 60% were unpaid workers working in family enterprises.
Table 12: Percentage Distribution of Women Workers
by Status in Employment (All ages, UPSS data)
| Self-employed | Regular wage | Casual labour | Total | |||
| Own-account | Unpaid Helper | Total | ||||
| 2017–18 | 20.2 | 31.7 | 51.9 | 21 | 27 | 100 |
| 2018–19 | 22.5 | 30.9 | 53.4 | 21.9 | 24.7 | 100 |
| 2019–20 | 21.3 | 35 | 56.3 | 20 | 23.7 | 100 |
| 2020–21 | 22.8 | 36.6 | 59.4 | 17.4 | 23.2 | 100 |
| 2021–22 | 25.4 | 36.7 | 62.1 | 16.5 | 21.4 | 100 |
| 2022–23 | 27.8 | 37.5 | 65.3 | 15.9 | 18.8 | 100 |
For women workers, the number of unpaid self-employed workers as a percentage of all women workers increased from 31.7% to 37.5% over the 6-year period 2017–18 to 2022–23. Their number is also much larger than that of men unpaid workers: thus, in 2022–23, women unpaid self-employed workers constituted 37.5% of all women workers, while for men, this figure was 9.3%.
As discussed above, international standards require all unpaid workers to be included in the category of unemployed. On this basis, we calculate the Actual WPR and Actual UR for women workers in Table 13. The reworked data give eye-popping results — the unemployment rate for women workers for 2022–23 shoots up to 39.2%, more than 13 times the official PLFS unemployment rate for women workers (2.9%, UPSS data).
Table 13: Actual WPR and UR for All Women Workers (All ages, UPSS data, in %)
| Official WPR | Actual WPR | LFPR | UR | |
| 2017–18 | 16.5 | 11.3 | 17.5 | 35.4 |
| 2018–19 | 17.6 | 12.2 | 18.6 | 34.4 |
| 2019–20 | 21.8 | 14.2 | 22.8 | 37.7 |
| 2020–21 | 24.2 | 15.3 | 25.1 | 39 |
| 2021–22 | 24 | 15.2 | 24.8 | 38.7 |
| 2022–23 | 27 | 16.9 | 27.8 | 39.2 |
Table 13 reveals that employment rate for women is abysmally low — just 17% of women are engaged in some economic activity that provide them with an income. This figure is among the lowest in the world. Women employment rates for other BRICS countries are more than double India rates: Brazil – 40%; China – 59%; Russia – 52%; and South Africa – 30%. According to the ILO, female WPR for Low Income Countries is 53%; for sub-Saharan Africa is 55%; while the world average is 43%. India’s female WPR is even lower than that for Saudi Arabia (23.6%).[22]
Even though WPR for women is low, it has increased by more than 5 percentage points over the period 2017–18 to 2022–23. To understand this increase, we give in Table 14 the percentage distribution of all women workers by status of employment, after shifting the category of unpaid self-employed workers to unemployed.
Table 14: Percentage Distribution of Women Workers by Status in Employment
after Excluding Unpaid Workers (All ages)
| Self-employed, Own-account | Regular wage | Casual labour | Total | |
| 2017–18 | 29.6 | 30.8 | 39.6 | 100 |
| 2018–19 | 32.6 | 31.7 | 35.7 | 100 |
| 2019–20 | 32.8 | 30.8 | 36.5 | 100 |
| 2020–21 | 36.0 | 27.4 | 36.6 | 100 |
| 2021–22 | 40.1 | 26.1 | 33.8 | 100 |
| 2022–23 | 44.5 | 25.4 | 30.1 | 100 |
Table 14 makes clear that the WPR for women has increased because of an increase in self-employed women — their number has increased by a huge 15 percentage points. This increase is mirrored by a steady decline in the percentage of women in regular employment as well as in casual labour. The decline in share of women in both casual labour and regular employment indicates that there has been no increase in job availability. It is this decline in job availability that is reflected in an increase in self-employment. Self-employment in India serves as a kind of reserve army of labour; when there are no jobs available, people do some or the other odd jobs to survive, and our data enumerators include all of them in the employed, even if the wages are destitution level wages. So actually this increase in self-employment and actual WPR only reflects distress employment; it is a result of an economy where job generation has come to a standstill.
This is also borne out by the PLFS data on earnings for different categories of work. As shown in Table 11 above, in 2021–22, the average monthly earnings for self-employed women workers was an abysmally low Rs 4,809 (in comparison, the average earnings for men was Rs 12,099 per month) — a wage that can only be called starvation wage (for 2022–23, this wage has marginally gone up to Rs 5,516). Despite such horribly low wages, the percentage of women in self-employment has gone up from 29.6% to 44.5%. It only means that this increase in self-employment is a reflection of disguised underemployment / unemployment.[23]
Nearly 75% of the employed women are self-employed or in casual work. Even if we conservatively assume that half of them are earning below-subsistence level wages, and include them in the unemployed, it means that in India, barely 10% women are employed — not 17% as estimated above!
Therefore, it is not at all surprising that the World Economic Forum’s Global Gender Gap Report for 2023 ranked India very low — 127 among 146 countries. The index measures gaps on four broad parameters (also called sub-indices) — economic participation and opportunities, educational attainment, health and survival, and political empowerment. India’s poor scoring on “economic participation and opportunities” for women contributed substantially to India’s low rank in the global list — India ranked 142nd (fifth lowest) on the subindex of “economic participation and opportunity”.[24]
Youth Unemployment
Even the PLFS data admit that youth unemployment rate is triple the overall unemployment rate (Table 15).
Table 15: LFPR, WPR and UR for Youth, Age 15–29 years (in %, UPSS data)
| WPR | LFPR | UR | |
| 2017–18 | 31.4 | 38.2 | 17.8 |
| 2018–19 | 31.5 | 38.1 | 17.3 |
| 2019–20 | 34.7 | 40.9 | 15 |
| 2020–21 | 36.1 | 41.4 | 12.9 |
| 2021–22 | 36.8 | 42 | 12.4 |
| 2022–23 | 40.1 | 44.5 | 10 |
The India Employment Report of the ILO gives disaggregated data for youth by status of employment for the year 2021–22, based on PLFS data. We give this data in Table 16.[25]
Table 16: Percentage Distribution of Youth (15–29 years)
by Status in Employment, 2021–22 (UPSS data)
| Year | Self-employed | Regular wage | Casual labour | Total | ||
| Own-account | Unpaid Helper | Total | ||||
| 2021–22 | 19.2 | 28.3 | 47.5 | 27.8 | 24.7 | 100 |
In accordance with international standards, excluding the unpaid workers from the category of employed and including them in the unemployed, the actual employment rate for youth in 2021–22 falls to just 26.4%, and the actual unemployment rate then goes up to 37.1%, more than 3 times the official PLFS unemployment rate of 12.4% (Table 17).
Table 17: Actual WPR and UR for Youth Workers (15–29 years),
2021–22 (in %, UPSS data)
| Actual WPR | LFPR | UR | |
| 2021–22 | 26.4 | 42 | 37.1 |
The ILO report mentioned above also points out that in 2022, the average monthly earnings or wages for youth in regular salaried work was Rs 14,583, in self-employment was Rs 10,100, and in casual work was Rs 8,315. The report also says that the percentage of youth in self-employment has increased from 42.2% in 2018–19 to 47.3% in 2020–21 to 47.5% in 2021–22.[26] This increase has taken place, despite the average wage for self-employed youth being below poverty line wage.[27] The average wage for youth in casual is nearly 20% less than this subsistence-level wage. All this only means that a very large number of youth in employment are actually underemployed / in distress employment, and should be included in the unemployed. This will send the youth unemployment soaring to more than 60%, maybe even 70%.
That there are no decent jobs, is also borne out by another statistic from PLFS surveys highlighted by the India Employment Report. The youth unemployment rate increased with the level of education. In 2022, the unemployment rate among youth was six times greater for those who had completed secondary education or higher (18.4%) and nine times higher for graduates (29.1%) than for persons who could not read or write (3.4%).[28]
Notes
1. Rosa Abraham et al., “A (Failed) Quest to Obtain India’s Missing Jobs Data”, 1 February 2019, https://thewire.in; James Wilson, “Lies, Deceit and Invented Truths in the Modi Regime”, 10 February 2019, https://www.telegraphindia.com; “2 More Members of NSC Quit on Feeling Sidelined”, 30 January 2019, https://economictimes. indiatimes.com.
2. Santosh Mehrotra, Jajati K. Parida, India’s Employment Crisis: Rising Education Levels and Falling Non-Agricultural Job Growth, October 2019, CSE Working Paper, https://cse.azimpremjiuniversity.edu.in.
3. Source for all tables: Annual Report, PLFS, July 2019–2020, and July 2022–23, available online at: https://mospi.gov.in.
4. Arun Kumar, “What the 23.9% Drop in Q1 GDP Tells – and Doesn’t Tell – Us About the Economy”, 2 September 2020, https://thewire.in; “State of Economy Far Worse Than Govt Admits, GDP Shrank by More Than What Govt Claims”, Arun Kumar interviewed by Karan Thapar, 30 January 2021, https://thewire.in.
5. State of Working India 2023, Centre for Sustainable Employment, Azim Premji University, https://publications.azimpremjiuniversity.edu.in.
6. Subodh Varma, “Central Government: 22 Crore Applied, 7 Lakh Got Jobs, 9 Lakh Posts Still Vacant”, 31 July 2022, https://www.newsclick.in.
7. India Employment Report 2024, ILO, p. 6, https://www.ilo.org.
8. “Maharashtra Police Receive More Than 11 Lakh Applications for 18,331 Vacancies”, 29 November 2022, https://economictimes.indiatimes.com; “Over 11 Lakh Applications for 4,644 Posts of Talathi in Maharashtra”, 21 July 2023, http://timesofindia.indiatimes.com.
9. “Over 55 Lakh Candidates with BTech, MBA, Master’s Degree Apply for Group D Jobs in Uttar Pradesh”, 6 June 2023, https://www.businesstoday.in.
10. Nachiket Deuskar, “How Modi Government’s Warning About Private Economic Data Ends Up Highlighting Its Own Failures”, 24 January 2023, https://scroll.in.
11. C.P. Chandrasekhar and Jayati Ghosh, “Faultlines in the Jobs Data”, Hindu Business Line, 19 October 2023, https://www.thehindubusinessline.com; Santosh Mehrotra, “Ten-Year Record on Employment: Does the Reality Match the Promises or Claims?”, 7 January 2024, https://thewire.in. See also: “Work and Employment are Not Synonyms”, ILOSTAT, 29 October 2019, https://ilostat.ilo.org.)
12. Arun Kumar, “What the 23.9% Drop in Q1 GDP Tells – and Doesn’t Tell – Us About the Economy”, op. cit.
13. Prabhat Patnaik, “The Mendacity of the “Rescue Package”, 24 May 2020, https://www.networkideas.org.
14. India Employment Report 2024, op. cit., p. 28.
15. State of Working India 2023, op. cit. This report has based its calculations on the basis of PLFS data, various rounds. This report carries data till 2021–22. For 2022–23, data is taken from: Udit Misra, “ExplainSpeaking: How to Read India’s Latest Employment Data”, 16 October 2023, https://indianexpress.com. Also note that PLFS gives earnings data in current weekly status. The earnings are adjusted for inflation using CPI-R and CPI-U, base April–June 2022 quarter.
16. Prabhat Patnaik, “The Pervasiveness of Poverty in India”, 27 November 2023, https://www.networkideas.org; For further reading on the 1973–74 poverty line and subsequent manipulations by governments, see: Utsa Patnaik, “Number Games: India’s Declining Poverty Figures Based on Flawed Estimation method; Accurate Figures Show 75 Percent in Poverty”, Academics Stand Against Poverty, https://academicsstand.org; Utsa Patnaik, Republic of Hunger and Other Essays, Three Essays Collective, March 2007.
17. “’India’s Workforce Not Rising, Quality of Jobs Very Low’: CMIE’s Mahesh Vyas”, 2 May 2023, https://thewire.in; “Decent Work – ILO”, https://www.ilo.org.
18. Labor Force Participation Rate, Total (% of total population ages 15–64), World Bank Open Data, https://data.worldbank.org.
19. The Employment Situation – Bureau of Labor Statistics, https://www.bls.gov.
20. Calculated from data in Table 3.
21. State of Working India 2023, op. cit. The report has based its data on PLFS 2021–22.
22. WPR calculation done by us, based on Female LFPR and Female UR data given in: Esteban Ortiz-Ospina, Sandra Tzvetkova and Max Roser, “Women’s Employment”, Our World in Data, https://ourworldindata.org, accessed on 20 April 2024.
23. For more discussion on this, see: Ashwini Deshpande, “Illusory or Real? Unpacking the Recent Increase in Women’s Labour Force Participation in India”, 19 December 2023, https://thewire.in; State of Working India 2023, op. cit., p. 53.
24. Global Gender Gap Report 2023, People’s Archive of Rural India, https://ruralindiaonline.org.
25. India Employment Report 2024, op. cit., pp. 82, 270.
26. Ibid., pp. 85, 268.
27. Using NSS data for 2017–18, the poverty line defined as the per capita expenditure level at which exactly 2200 calories were accessed in rural India in that year, works out to Rs 8,400 for a family of four. Adjusting for inflation, it works out to Rs 10,164 for 2021–22: Prabhat Patnaik, “The Pervasiveness of Poverty in India”, op. cit.
28. India Employment Report 2024, op. cit., p. 89.
…………………………………………………………………………………………………………………………………………….
About the author:
Neeraj Jain is a Btech in Electrical Engineering. He is a social-political activist with an activist group called Lokayat in Pune, and is also the Associate Editor of Janata Weekly, a weekly print magazine and blog published from Mumbai.
Email: [email protected].