A major issue in climate economics is whether it is possible to halt the growth in carbon emissions and to achieve, instead, a rapid reduction. It concludes that carbon emissions will never fall at a sufficient rate in a growth economy. Unfortunately, the EU operates a climate policy framework, the EU Emissions Trading System, that was designed by BP and it doesn’t work. Policies that might work were the political will there are described. However, the fossil fuel industry still has a stranglehold on policy.
An entirely different way of thinking about climate issues is needed, one that is consistent with the limits to growth paradigm. The alternative way of framing the climate debate is:
• Humanity is faced with the high likelihood of a catastrophic ecological tipping point and this crisis is part of a general crisis at the limits to economic growth
• There are many unknowns at that tipping point – beyond which there might be runaway climate change because of feedback
• This tipping point imposes the need for an absolute limit on what can safely be emitted and what must be clawed back out of the atmosphere – given the uncertainty with a need for a high margin of safety
• This limit trumps any growth agenda because the danger is so great and ecological scale limits must be imposed in physical quantities (e.g. of allowed carbon emissions) before the market can be allowed to operate
• The limits to economic growth require that climate policy be part of a more general transition of society and economy for which efforts must be made to enrol everyone.
• Techno-innovation may have a role in the transition but will not be the sole or even the main method of reducing energy consumption – moral, cultural, behavioural and other changes are also needed.
• Limits need to be imposed as equitably as possible as part of the larger transition
• We need to get on with this task now, as a matter of urgency
Decoupling – relative and absolute
Central to the alternative approach is a focus upon what is called “de-coupling”, also sometimes described as “de-materialisation”. The question at stake here is whether it is possible to grow the economy and, at the very same time, achieve an absolute reduction in the throughput of energy and materials, that is, to decouple growth from increased material and energy usage. More specifically, in relation to the climate crisis, is it possible to grow the economy and reduce carbon emissions at the same time? Various proponents of degrowth do not deny that it is possible to increase the efficiency with which energy and materials are used in the economy. They do not deny that the amount of carbon emitted per unit of output can be decreased and that “relative decoupling” can occur. What they do not believe is that absolute decoupling can be made to work – and certainly not on the scale necessary to avert the danger of runaway climate change.
No good or service can be produced without energy – even “information” requires energy to run the computers or make and print books, magazines and newspapers. As the economy grows it requires more energy and, because virtually all energy in our society is generated by burning carbon fuels, that means more CO2 emissions. The figures show clearly that for decades, carbon emissions and economic activity fluctuate together in lockstep. This is a key concept already discussed in the chapters on production and technology but, to refresh the point, here are two graphs compiled by Gail Tverberg, drawing on GNP calculations by Angus Maddison, energy calculations by Vaclav Smil, supplemented by information from BP, EIEA and USDA. (Tverberg, 2012)
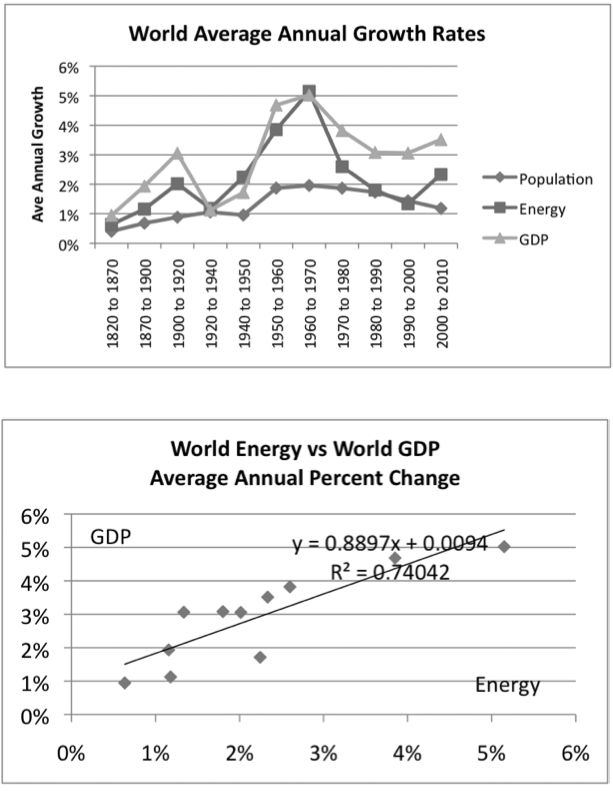
The graphs show that energy production and world GDP are highly correlated and, since most of the energy is derived from fossil fuels, this involves increased emissions. Unless the connection between growth of production and growth of emissions can be broken, and to a sufficient extent, there can be no reduction of carbon emissions without an end to growth – indeed without contraction.
At this point, a reminder is necessary. It may be that depleting fossil fuel supplies and the production crunch brought about by rising energy and material costs that was described in an earlier chapter, will achieve a considerable turn down in carbon emissions anyway. This would not be a particularly pleasant resolution of the crisis but it would certainly change the conditions in which the climate crisis would have to be resolved. On the other hand, the global power elite appear to be hell bent on continuing
to extract and use carbon based fossil energy if they can, so we cannot totally be sure if things will evolve into this kind of crunch. This is despite the fact that in 2012 the International Energy Agency acknowledged that 2/3 of recoverable carbon in fuels needs to stay in the ground up to 2050 to have any change of staying below a temperature increase of 2degrees C. This matches findings from the IPCC working group 3. (IPCC.WG3.Final Draft AR5. Presentation 2014)
There is plenty of carbon here to bring greenhouse gas concentration levels well above 600 ppm. As we have already seen, fracking for shale gas is just one of several options being pursued to get new fossil energy sources out of the ground in the face of the depletion gradients, bringing with it the threat of high fugitive methane losses. Underground gasification of coal is another technology based on extracting the energy from deep coal seams by partially burning it underground to extract the energy in the form of syngas. When it comes to the surface, syngas can be burned to generate electricity. If this can be made to work, there are unfortunately very large reserves of coal in the world that can still be used as energy sources.
Worse still, attempts are being made to tap “frozen” methane from the oceans called methane hydrates. This is a dangerous process because methane hydrate unfreezes from its crystalline form directly into methane gas and, when it does so, it enormously expands in volume. The process is thus, very unstable and explosive. However, Japanese technologists claim to have been able to do it and might be able to turn this into a commercial venture. (Reuters, 2013)
The description of the situation at this point in the analysis is to use what is called the Kaya identity after a Japanese energy economist Yoichi Kaya, who proposed a way of breaking down the different components to explain the growth (or reduction) in total emissions. These components are growth of the economy measured as GDP per capita (GDP/population); growth of the population; the energy intensity needed per unit of economic output (energy/GDP) and the emission intensity of that energy (CO2e/energy).
It can be readily appreciated that emissions from the last two components can be reduced as a result of:
• Increasing energy efficiency – the amount of energy used per unit of economic output/service is reduced brought about by more insulation in buildings, lighter more efficient vehicles, machinery etc.
• Decarbonising energy sources – the amount of carbon used in generating energy is reduced by switching to renewables – wind, solar, tidal, wave etc. It also requires changes to the grid to balance for “intermittency” as well as switching to an electric infrastructure (e.g. electric cars)
At this point, the distinction needs to be drawn out between relative decoupling and absolute decoupling. Relative decoupling means that for every unit of output less carbon emissions are generated. Another way of saying this is that the “carbon intensity of output falls”.
In his book Prosperity without Growth, Tim Jackson gives figures which show that the global carbon intensity declined by almost a quarter from just over 1 kilogram of CO2 per one US dollar output in 1980 to 770grams of carbon dioxide per US dollar in 2006. (Jackson, 2009, pp. 48-50) The fall in CO2 intensity per unit of economic output did not mean, however, that the absolute volume of carbon emissions fell. Because growth of production per capita and population grew even faster, the total amount of carbon emissions went up – even though, due to “relative decoupling”, carbon dioxide emissions rose at a slower rate than GDP. To sum up, this was relative decoupling but not absolute decoupling. (Jackson, 2009, pp. 50-53).
As a rule of thumb, absolute decoupling will only start to occur when the rate of relative decoupling is greater than the rates of increase of population and income combined. Thus, with global population increasing at 1.3% and the global per capita income increasing at 1.4% per year in real terms, the required technical improvement (reduction) in carbon intensity is greater than 2.7% (1.4% + 1.3%) per year. So what has the rate of technical improvement been? As Jackson computes the figures, carbon intensity has only been improving at 0.7% per annum. Thus, emissions have been increasing at 2% per annum.
Since Jackson’s book was published, more up to date figures published by the IPCC’s Working Group 3 for the 5th Assessment Report shows that the situation has deteriorated. This is not only because of growth in population and per capita growth, but also because the emission intensity of energy has increased. ( IPCC. WG3. Final Draft AR5 Presentation 2014 )
While the efficiency with which the global economy uses energy, as measured by the energy/GDP ratio, has continued to improve, the slow decarbonisation of the global energy supply has been put into reverse. The carbon intensity of energy is actually increasing, particularly as more coal is being used. The fact that there is so little sign of hope appears to be because, as depletion has driven up oil and gas supplies and prices, coal is being turned to instead, as well as more emission intensive sources of oil and gas (like Canadian tar sands and shale).
The scale of the challenge – the necessary rates of emissions reduction
These figures should be compared with what a team of climate scientists have calculated is the necessary rate of reduction.
“Keeping global climate close to the Holocene range, we will conclude, requires a long-term atmospheric CO2 level of about 350 ppm or less, with other climate forcings similar to today’s levels. If emissions reduction had begun in 2005, reduction at 3.5%/year would have achieved 350 ppm at 2100. Now the requirement is at least 6%/year. Delay of emissions reductions until 2020 requires a reduction rate of 15%/year to achieve 350 ppm in 2100. If we assume only 50 GtC reforestation, and begin emissions reduction in 2013, the required reduction rate becomes about 9%/year.” (Hansen, Kharecha, Sato, Masson-Delmotte, Ackerman, et al. 2013)
Another climate scientist, Kevin Anderson, argues that to stand an outside chance of not rising more than 2 degrees C, global emissions will have to stop rising at the latest by 2020 and will then have to fall by 10% per annum thereafter. (Kevin Anderson, “Pick a card – any card… How in funding targets to meet politically palatable goals, climate scientists undermine issues of equity and fairness”, Presentation to the Joseph Rowntree Foundation, March 2013 and available at http://kevinanderson.info )
The graph below shows Anderson’s presentation of the options – the continuation of business as usual trends would mean a 4 to 6 degree C increase.

Just to stop global emissions growing, if GDP growth rates are 2.7% pa then carbon intensity must reduce at 2.7% per annum, which is nearly 4 times the current rate of improvement. In order for emissions to fall at 10% per annum, if growth continued at 2.7% pa, this would require carbon intensity to improve (reduce) at 12.7 % per annum. This is 18 times the current rate of improvement. (Anderson K. 2013)
Such a fall seems inconceivable in a growth scenario so that Kevin Anderson and his colleague Alice Bows had already in 2008 taken the view that:
“… dangerous climate change can only be avoided if economic growth is exchanged for a period of planned austerity within Annex 1 nations at the same time as there is a rapid transition away from fossil-fuelled development within non-Annex 1 nations.”(Anderson & Bows, 2010)
The climate crisis is still on…
In his March 2013 presentation to the Joseph Rowntree Foundation, Anderson has moved on with the recognition that the necessary reductions barely affect a very large proportion of the world’s population. The austerity has to be carried by the elite. Perhaps 1% of the global population accounts for 50% of all emissions and if we take the top 5% we are talking about the top 60% of emissions. It is above all the carbon intensity of the lifestyle of the global elite that is taking us all to climate hell and it is the lifestyle of this elite that needs to be tackled.
So how can this be done – and as part of a larger societal response to the limits to economic growth?
• Try to calculate (with a very safe margin for error) the small amount of additional carbon that can be emitted to stay well back from the runaway tipping point
• Only permit that very limited amount of carbon to be released – and let the market set a price for that amount of carbon
• Do this in a way that affects everyone but hits the richest the most because they are responsible for most of the emissions
Of course, saying this begs the political question of how such a policy can be brought about, but we will park that question at this point and come back to it later. The assumption for now is that some organised agency can be found with the political will and power to set an absolute ceiling on the amount of carbon based fuels that are allowed into the economy. Or, put the other way around, an agency is created with the power to keep most remaining fossil fuels in the ground untouched. This will then, in turn, force a number of other processes such as:
• Lifestyle changes – eating less meat which is an energy and carbon intense foodstuff; cycling and walking more and less travel; more growing your own food; voluntary reductions in consumption with a culture of “sufficiency” reductions.
• Energy efficiency in buildings, production, transport plus…
• Renewable generation – wind; solar voltaics + thermal, concentrated solar power; hydro, tidal, wave power; some bio-
• Technologies to complement renewables – electric storage technologies and grid balancing
• Land use changes, ecological design, organic agriculture with protection against deforestation
and degradation of peat lands and
• Enhancement of carbon sequestration in land and biomass
Effective cap and ineffective caps – how the Eu operates a policy designed by BP that doesn’t work
But is it possible to impose a carbon price (or a cap)? How is it possible to drive a process of decarbonisation? What can be done about emissions from land use changes and deforestation? What is to be done about other sources of global warming like black carbon, methane emissions, N2O emissions, HCFCs and so on? There are lots of questions in climate policy that need answers. It is not straightforward by any means.
Taking the question of the cap first. At the time of writing, the very idea of a “cap” is greeted with scepticism by many climate activists because current policies of “cap and trade” have been so ineffectual. But, to be fair, the word “cap” has been abused. A “cap” should mean an absolute limit but in current policy frameworks it is no such thing. The so called “cap” operated by the European Union does not function as a real restraint. It has been designed to leak because fossil fuel business interests had control of the policy making process and the policy making implementation. The problem is not with the idea of a cap. The problem is the power of the fossil fuel lobby that has made a nonsense of its practical implementation. If a carbon tax was used instead of a cap, the very same problem would still be there. The fossil fuel industry would do everything in their power to undermine an effective tax too if it hit their profits and power, which an effective tax would. This is the fatal weakness in the ideas of James Hansen and others, including economist Jeffrey Sachs, who call for a carbon tax, as a solution.
It should not surprise that the cap and trade policy in Europe has failed. As we have seen repeatedly in this book, policy is written by the polluters for the polluters and when the European Union’s Emissions Trading Scheme was set up, it was no exception. For a long time, the major fossil fuel suppliers had resisted any restraint on emissions but, at the end of the 1990s, some of them changed tack. Recognising that some policy was inevitable, companies like BP in Britain moved to take over the policy making process and thus, turned it to their own advantage. BP first experimented with an internal emissions trading scheme which was started in 1999. In 2002, the BP model was scaled up with the support of the UK government’s Department of the Environment and 34 other voluntarily participating companies. This UK scheme, in turn, became a model for the European Union’s Emissions Trading Scheme. This was despite the fact that, from very early on, it was evident that the BP scheme was ineffectual. The supposed “cap” that it used did not really restrain emissions. Some of the later problems of the EU’s
ETS were already visible in the earlier BP/UK government experiment. However, such was the lobbying power of BP and its corporate allies, that their format was adopted anyway.
“Two years into the UK scheme, it was examined by the House of Commons Select Committee on Public Accounts. Labour MP Gerry Steinberg described the scheme as a “mockery” and an “outrageous waste of [public] money”. BP was one of a number of UK companies which had lobbied so successfully for a generous emissions allowance that it massively over-complied in the first year of the scheme, leaving the company free to profit from the sale of its surplus allowances. The fact that emissions were already limited by the government’s Climate Change agreements led Edward Leigh, the Conservative chair of the Public Accounts Committee, to observe that the scheme seemed to be “paying these companies 111£ million for keeping emissions down to levels they had already achieved before they joined”. Leigh also observed that “half the point of this was to try and encourage Europe to do a similar scheme”.
“The committee’s enquiry revealed that the scheme’s success was not in reducing greenhouse gas emissions but in turning the atmosphere into “a commodity market like any other” and that far from being a side effect, this had been the intention of the scheme.” (Corporate European Observatory and PLATFORM, 2009, pp. 4-5)
In the circumstances, it is not surprising that “caps” have got a bad name. If a solution for the problem of corporate lobby power in the political process could be found, a cap would be the simplest and most direct approach.
The starting point for understanding how a cap should work are the following easily available conversion figures. They show the carbon content of different fuels when burned, reduced to a common measure. Thus, 1 kg CO2 = 1 Carbon Unit (Note the Global Warming Potential of non-CO2 warming gases like methane are measured in units called “Carbon dioxide equivalents” which are noted with an “e” after CO2, as in “CO2e”). As examples natural gas = 0.18404 carbon units per kWh or industrial coal = 0.31304 carbon units per kWh (a tonne of industrial coal = 2339.1 carbon units) (Carbon Trust, 2013)
(Matthews, 2012)
For each physical quantity of a particular kind of fuel, or for each quantity of energy, it can readily be calculated how much CO2 will be emitted when that quantity is burned. If the political will could be found, it is therefore entirely possible to construct a policy administration that could control how much carbon can be allowed to be burned in any time period.
You could do it like this. All fossil fuel sales would be banned unless first authorised by a permit. The number of permits, which would be denominated in carbon units, would be limited and reduced rapidly year on year.
In order to acquire some of the limited numbers of permits, the fossil fuel sellers would have to obtain them. As is obvious, the permits would be very expensive to buy if the cap were tight enough. The fossil fuel sellers would pass on the permit cost to their customers so that the price of fossil fuels would rise, perhaps very considerably. The prices of goods made with large amounts of fossil fuels would also rise. This would not be at all popular and would particularly hit people with a carbon intensive lifestyle, which, as we have seen already, is largely the very rich. However, poor people would be hit too. That is why it would be necessary that the large amount of money raised when permits are sold, should be recycled back to the population on a per capita or some other equitable basis. It might also be necessary to do more to help the high carbon poor in countries like the USA but that is a detail that I will not go into here.
This will achieve what Kevin Anderson wants to see, that is, a scheme that cuts the carbon intensive lifestyle of the rich most, while making a very large number of poor people better off, at least in the early stages of the process. The reason that they will be better off is that if the revenue from carbon permit sales is recycled back to the public on a per capita basis, then everyone, rich or poor, will get exactly the same amount of the revenue from permit sales. However, the poor tend to have a less carbon intensive lifestyle. Although prices for their lifestyle will rise, they will still get more from their share of the carbon permit revenues than they will pay extra in rising prices.
“The 1%”, however, will be paying a huge amount more because, directly and indirectly, their energy intensive lifestyle accounts for 50% of all carbon emissions and carbon will have become very expensive. Despite this, they will only be getting back the same share from the carbon permit revenues as everyone else.
In the book Sharing for Survival, Laurence Matthews illustrates this graphically with a very simple example for an imaginary country consisting of only 10 people with CO2 emissions as shown (in units of tonnes of CO2). The total of all emissions is 15 tonnes and so the average is 1.5 tonnes. (Matthews, Cap and Share in pictures, 2012, p. 52)
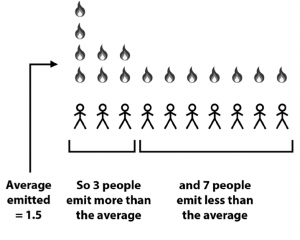
Laurence Matthews comments:
“A majority would be in favour of maintaining a tight cap, since they gain financially. This is a force to counterbalance the vested interests who would push for a cap to be relaxed or abandoned, and this counterbalance gives a certain political robustness to C&S in the face of shocks and political events.”
If such a scheme was adopted in 2020, the number of carbon units permitted would need to be reduced by at least 10% per annum to have an outside chance of the planet staying under 2 degrees C. A reduction of available energy of this magnitude, if at all possible, would need to drive a massive reduction of production, chiefly, the production of things that enter into carbon intensive lifestyle of rich people in the manner explained above.
A policy like this would lead to a very dramatic process of “degrowth” because production is dependent on energy. With fossil energy availability radically reduced by a cap that really bites, the amount of production in the economy would be driven downwards. An upstream cap imposed on sellers of coal, oil and gas can cover ALL fossil fuels entering the economy and would be simple to impose, at least in administrative terms. Most countries already impose duties on fossil fuel sales so there are procedures already in place monitoring the input of fossil fuels into different economies.
Obviously, administrative simplicity is only a part of the problem of setting and operating a cap. Driving a contraction of the economy would be immensely unpopular, unless accompanied by multiple other policies and social changes to enable billions of people to achieve dramatic changes in their lifestyles. These changes should be, above all, concentrated on the rich and would have to be made anyway because of depleting fossil energy and materials resources. They are described in greater length in the final chapter and in this chapter are “parked” for now.
Needless to say, this is nothing like the working of the policy architecture designed in Europe by BP, its corporate allies and government. The European Union policy was designed, consciously or unconsciously, to deflect direct controls away from the fossil fuel industry onto its customers. It is riddled with loopholes and special clauses that make it easy for large businesses to game the system and generally to make it unworkable. Because of business pressure so many permits have been issued that there is no real restraint on emissions in practice. Rather than having a direct control over what fossil fuels are allowed into the economy, the policy architecture has been focused upon the users and uses of fossil fuels at the demand end. In the jargon, the policy is imposed “downstream” rather than “upstream”.
As is obvious, the number of users and uses of fossil fuels “downstream” is much greater than the number of suppliers “upstream”. Something that this diagram, again devised by Laurence Matthews, is intended to illustrate:

It would have made sense to control emissions by capping the amount of fossil fuels going into the system at the source of initial supply. This is called capping the emissions “upstream”. The fossil fuel suppliers would have to have emissions permits (indicated by the yellow rectangles) to cover the emissions caused by the fossil fuels they bring into the system.
This is illustrated in this diagram:

What happened instead in Europe was that the ETS was imposed downstream on large fossil fuel users. These are companies running power stations, cement works, steel mills and the like. This covers 45% of the EU’s CO2 emissions.
Individuals are not covered in this scheme but could be through “personal carbon trading” (PCA) – based on “personal carbon accounts”. The problem is that this would be administratively complex. Everyone would have to have their own personal carbon account, presumably by using a carbon card rather like a debit or credit card.

In the early stages of the European ETS, most permits to emit were initially distributed to the main emitters for free. This meant that, to the extent that the permits had any market value, it was the companies that captured their value. The mechanism and reasoning worked like this: companies that have to surrender their permits because they have been emitting CO2 reason that, because the surrendered permits have a market value, surrendering them means the loss of this market value to the company. Thus, as far as the company is concerned, this loss when their permits are surrendered is one of their costs of operation. So, even though they were given the permits in the first place, they pass on this “cost” to their customers in increased prices.
Because it was designed by pushers of fossil fuels, the European Union established a system that runs on a “pay the polluter” principle. The idea is supposed to be that, over time, more of the permits will be auctioned by states which will capture the revenue raised. However, there has been some dragging of feet on this and governments are reluctant to implement this system in favour of their fossil fuel corporations. Poland has even wanted to use revenues arising from ETS permits to subsidise new coal fired power stations. (Though been taken to court over this by an environmental NGO, ClientEarth).
The Earth’s atmosphere as a common Pool resource that ought to be managed as a global commons
What is at stake as regards who gets the carbon permit revenue is the question of who owns the right to use the earth’s atmosphere. The implication of allowing companies to capture the market value of the permits is that the right to use the earth’s atmosphere belongs to them. The implication of auctioning and revenues going to governments is that the right belongs to states. The idea that the earth’s atmosphere might “belong” to all of us – and that all of us have a responsibility for it – does not appear to have ever occurred to economists, corporate lobbyists, officials or politicians. Nevertheless, there have been more astute commentators who have grasped what is going on. It’s another enclosure process. For example, at the time the ETS was being designed, two authors associated with a German environmental think tank, the Wuppertal Institute commented:
Parcelling out shares of the global atmospheric commons to be exchanged among trading partners appears to be strikingly similar to the enclosure of the communal forests in 18th century Europe. Just as the enclosures put in place both property rights and forest protection, denying access to the common people, the assignment of emissions permits ensures protection by granting property rights, eliminating unregulated use by any player involved. (Ott & Sachs, 2000)
In the USA too, economist Peter Barnes described the atmosphere as a common pool resource and wrote a book titledWho Owns the Sky?. In his book, he argues that use of the atmosphere should be managed by a trust with a fiduciary duty to protect it by limiting its use and that the carbon revenue arising from the renting of these rights should be paid to everyone (in a US scheme) equally. (This is called “cap and dividend”). (Barnes, Who Owns the Sky? , 2003)
Policy is not made on a level playing field and the ETS, with all its weaknesses, is what we have ended up with. It has been complemented within the framework of the Kyoto Protocol with a scheme called the “Clean Development Mechanism”.
The clean Development mechanism
The “Clean Development Mechanism” is particularly interesting for the way that it throws light on policy mechanisms which are supposed to work by “incentivising” change. As already explained, neoclassical economists assume that one can manipulate means-ends relationships in order to make environmentally benign behaviour pay in money terms. What is supposed to happen is that good environmental/climate ends are achieved by means of incentive schemes which make them financially worthwhile. What the experience of the CDM shows, however, and very clearly, is that what are incentivised are not changes in environmental behaviour but ways of “gaming policies” to cynically make as much money from them as possible.
The clean development mechanism (CDM) was supposed to be about supporting “clean” projects in “developing” countries so that they can claim carbon credits for “certified emission reductions” (CERs) which can be sold into the permit schemes operating in “developed countries”. In practice, this has mainly meant into the European Union’s Emission Trading System.
The idea was to encourage “developing” country projects in renewable energy, energy efficiency and fuel switching which would not have otherwise taken place. What was supposed to happen was that “emissions reductions” in “developing” countries would entitle projects to credits. The number of credits were to be calculated by comparing actual emissions by the project concerned to a baseline of what would have otherwise have happened if the project had made no efforts to reduce its emissions.
But how are projects supposed to establish “what would otherwise have happened”? This way of setting up the policy has been a recipe for fraud and for gaming. Many participants have created an inflated base line by increasing actual or stated emissions in the short term before the CDM project was established. Or they set up “projects” in order to close them down. The scams have been particularly profitable in projects that appear to “abate” the production of hydroflurocarbons which are very powerful greenhouse gases as well as gases which destroy the earth’s ozone layer. Given the magnitude of the profits generated from CDM credits, it was profitable to build whole new facilities involving hydroflurocarbons just for the value of destroying the by-product. (SourceWatchWiki, 2009) The recognition that this is a problem finally led to a revision of the CDM crediting rules for the issuance of CERs, which were made more stringent in 2011.
“Yet it is still not stringent enough and still threatens to undermine the goals of the Montreal Protocol and the protection of the Ozone layer. The revised rules also do not apply until projects have to renew their crediting period. This means from 2012 until the end of the first crediting periods (seven years after a project started), well over 24… (Industrial Gases (HFC-23 & N2O), 2012) 2012) As of 1 June 2013, the CDM had issued 505,125 CERs, or 38% of all CERs issued, to 23 HFC- 23 destruction projects (Wikipedia, Clean Development Mechanism, 2013)
Another scam has involved dams. Barbara Haye calculated that more than a third of all hydro-projects recognized as a CDM-project “were already completed at the time of registration and almost all were already under construction” (Haya, 2007). Several years later, despite intensive lobbying by NGOs the need for reform was recognised but governments were again dragging their feet, with many controversial and environmentally damaging hydroprojects still in the pipeline. (Yan, 2012)
The CDM shows clearly what is wrong with current climate policy. It has been infested by crooks. This statement is not meant as rhetorical overstatement for effect – but literally.
Brian Davey trained as an economist but, aside for a brief spell working in eastern Germany showing how to do community development work, has spent most of his life working in the community and voluntary sector in Nottingham particularly in the health promotion, mental health and environmental fields. He helped develop Ecoworks, a community garden and environmental project for people with mental health problems. He is a member of the Feasta Energy and Climate Working Group and the Co-ordinator of Cap and Share UK. His life-long interest is why and how people and systems break down. He lives in Nottingham.
Originally published by Feasta

