We have been seeing and hearing a lot of visual and print media news and statistics of the ongoing Covid-19 pandemic. This will continue for some time to come. Almost all reports give the absolute number of cases and deaths. As on 7 Jul 20, with nearly 3.1 million cases and 134,000 deaths the USA is on top, Brazil with 1.67 million cases is No 2 and India with 760,000 cases is No 3.
This is not the way we have been seeing other health or socio-economic data of different countries or region. The health data are normally presented as rates of birth, infant mortality, cancer death etc per thousand people. I could not figure out as to why international agencies like the WHO has departed from this historical practices. During the early days of the pandemic, WHO used to give the number of cases, deaths and recoveries and the total population of 31 provinces in Mainland China. Even this practice has been discontinued since.
A map published by the WHO, showing three countries – US, Brazil and India with the highest number of cases, is reproduced below: Even though this is factually correct, it may have negative feelings among some viewers.

In this note I have calculated the rate of Covid-19 infection per one million population of the country or the region. Covid-19 has shown its presence 215 countries/regions in the UN system. The rate for China is 58 per Million and her position is 189th in the world. India has 506 per Million and her position is 114th.
Graph 1: Covid-19 Cases in select countries as on 04 Jul 20 – Rate per million
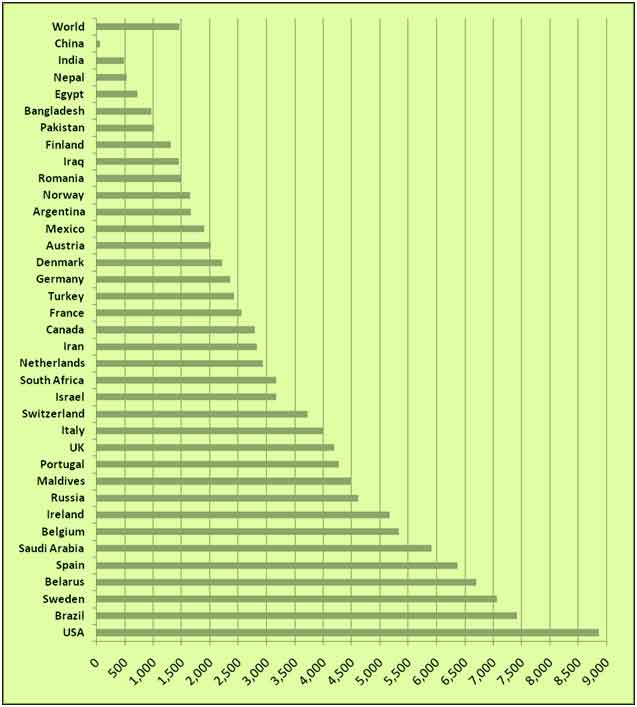
Graph 1 shows the infection rate for 38 countries, which together have 65% of the world’s population and 88% of the Covid-19 infections. The rate given in per million population. Acutally, the US is not the No1 country as far infection rate is concerned. The US is the 6th country. The top slot is occupied by Qatar with a population of 2.8 million, 80% of whom guest workers, most of them living in crowded hostels. Qatar’s infection rate is 35,324 persons per million. The rates for other top countries are Bahrain – 16933, Chile – 15,266, Kuwait 11,544 and Peru 9070.

Graph 2; Rates per 1000 people in 51 US states are shown in Graph 2. Not all states in the US are equal. The rate for New York is 22,000 as against 2,000 per Million in Hawaii. 13 states with rates above 10/Million account for 41% and 18 States with rates between 5 -10 /per million have 51% of the total US Caseload.

Graph 3 and 4: Rates in Counties of New York. All 62 counties in New York has Covid-19 cases. With 42 per thousand persons, Rockland is on top. With 0.7 per 1000, Franklin holds the lowest position. Graph 3 has data for counties with infection rate of 5000 and above and graph 4 has counties with rates below 5000 per million peoples

INDIA
The infection rate in India is 506 per million population. This rate is about 10 times that of China, which means India did not learn any lesson from there. Globally, India’s position is 114th.
The rate in US is 8,900. The average for the world is 1500 per million. State-wise, the National Capital Region (NCR) of Delhi with a total population of 18.7 million has the highest infection rate of 2671 per million. The Union Territory of Ladakh with a population of 290,000 has an attack rate of 2377 per million. Delhi and Ladakh are not shown in the Graph
About 70% of the cases in Maharashtra are in Mumbai metropolitan region. The infection rate in Dharavi, the biggest slum in Asia with an area of 6 sq km and a population of 650,000 is 3,555 which is less than a tenth of the rate in Qatar. As of now, the Dharavi cluster is under control. According to The Hindu, the success can be attributed to effective containment strategy, conducting comprehensive testing and ensuring uninterrupted supply of goods and essential supplies to the community.
INDIA – RATES PER MILLION BY STATES AND UTs AS ON 18 JUN 20 AND 04 JULY 20
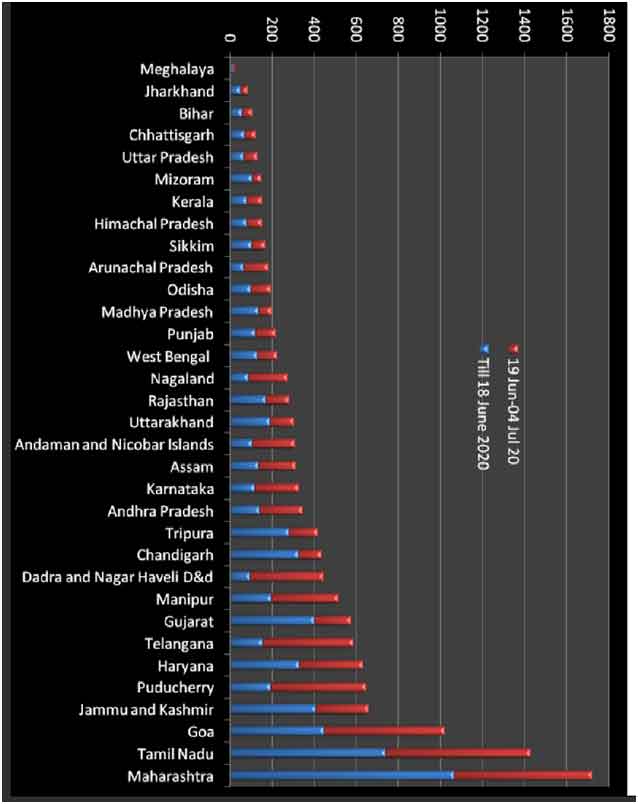
COVID -19 IN INDIA – INCREASE IN INFECTION RATE BETWEEN 18 June 04 JUL 2020
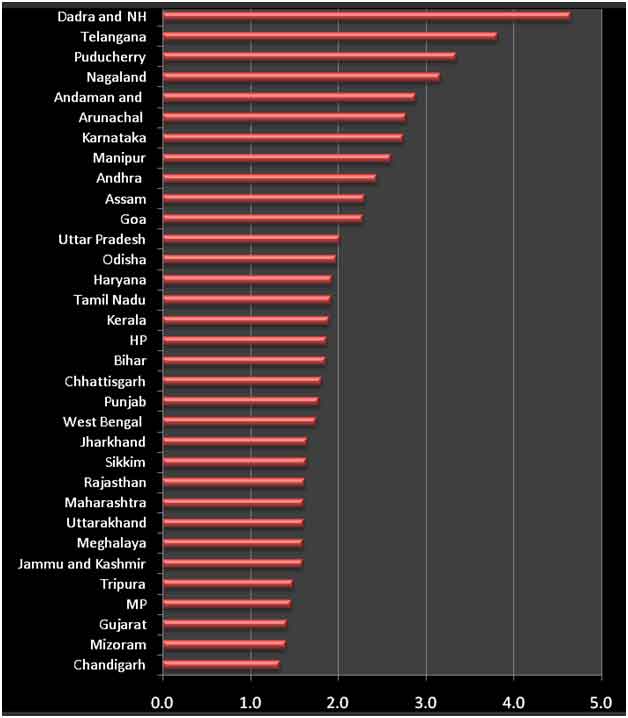
Graph 6 gives the trajectory of the pandemic in India during 18 June to 04 July 2020. The growth rate ranged from 3.8 in Telangana to 1.3 in Chandigarh.
The infection rate in counties like Richmond and Suffolk in New York State is above 40,000 per million. In comparison to that, rate in Dharavi in Mumbai, is less than a tenth. An expert had earlier theorized about some inherent stuff in India, which prevents the spread of the disease. We have to remember that there were only 1255 cases on 30 March 2020. After about 100 days we have now more than 700,000 people, an increase of more than 500 times.
The lower rates in most of India, other than big cities, means that we are in a relatively safer zone. The tragedy unfolding in high infection rate places like Chennai, Delhi and Mumbai should make us more vigilant.
The vaccine and drug industry is putting all their might to save the world from the pandemic. Of this vaccine group is the most active. For decades, they have not invent a vaccine, though there have been several viral epidemics. If the disease is contained at the earlier stage, as the Chinese did it, there is no scope for vaccine research and sales. China and India are also in the vaccine trail. If these two succeed, the chances of getting a vaccine which is affordable for majority of the people are brighter.
The USA is not seriously thinking about bringing the epidemic under control. The talk is generally centred around getting a vaccine by the year end. India and several other countries in the world do not have to wait for the magic bullet. Because it may not arrive as the scientist know very little about this virus. As the virus is going to be with us for a long time, we have to embrance the simplest preventive measures -the face mask, social distance and hand hygiene.
==============
VT Padmanabhan is a researcher in health effects of radiation. He has led epidemiological investigations among people exposed to high radiation in Kerala. He has also studied the occupational radiation hazards among workers of Indian Rare Earths, genetic effects of children exposed to MIC gases in Bhopal, health hazards to workers in a viscose rayon unit in Madhyapradesh and reduction of birth weight of babies near a beverage bottling plant in Kerala. He has visited several contaminated sites in Belarus and Japan and had extensive interactions with the survivors.His papers have been published in International Journal of Health Services, Journal of American Medical Association, International Perspectives in Public Health, the Lancet and Economic and Political Weekly. He is a member of the European Commission on Radiation Risk, an independent body of experts appointed by the Green MEPs in Europe.
SIGN UP FOR COUNTERCURRENTS DAILY NEWSLETTER


