As on 26 July 2020, there are 16.5 million confirmed cases and 0.65 million deaths of Covid-19, an infectious disease caused by the virus- SARS-Cov-2 in 214 countries and territories under the United Nations system. In India, Kerala State reported the first laboratory confirmed Covid-19 on 30 Jan 2030, ten days after the eminent Chinese epidemiologist Dr Zhong Nanshan announced the sustained person to person transmission of SARS-Cov-2 in Wuhan. Kerala also happens to be the first State in India, where the Chief Minister Pinarayi Vijayan on Jul 17, 2020 announced community transmission of Covid-19 in two coastal hamlets in Thiruvananthapuram
The first three cases in Kerala were students who returned from Wuhan during January 2020. The patients were isolated immediately. During the second week of March, the second batch of 6 cases surfaced from among the returnees from Italy. The first case of transmission to a resident was reported on 10 March 2020. On 23 March, the State Government imposed a lock-down, before the central government declared a nationwide lock-down. When the first wave of the epidemic ended on 4th May 2020, there 499 cases of which 175 were non-travellers, referred to as contacts in this paper. Three people lost their lives.
During May-July 2020, 5, 79,310 persons came from outside, half of them from abroad and the rest from other Indian States. The infection rate among the returnees so far is 1.5%. They accounted for 48% of the total confirmed caseload in the State.
The caseload as on 05 May 2020 was 500; it doubled to 1000 in the next 43 days. There were four more doublings since then in 12, 20, 15 and 11 days. The data as on 25 July 2020 is given in table 1.
Table-1 Covid-19 Caseload in Kerala – 25 Jul 20
| Total Confirmed | 19025 |
| Case Per Million Population | 544 |
| Recovered | 9300 |
| In Hospital | 9655 |
| Total With symptoms (58%) | 11035 |
| Death | 61 |
| Case Fatality Rate* | 1.1% |
*Note: Case-Fatality Rate (CFR) = Death/(Recovered+Dead)*100. Asymptomatic cases not included in the denominator
The CFR for Covid-19 is 0.61% in 30 Provinces of China (other than Hubei), 6.1% for Wuhan, China and also in the rest of the world. Kerala’s CFR is five times lower than the world average.
The First Clinical Management Report of 500 Cases
The Government of Kerala (GoK) has published a Clinical Management Report of the first 500 cases seen during the first phase of the epidemic. According to this report, 42% of the cases were asymptomatic throughout the course of infection. All of them were accommodated in the hospitals for about 10 days, till their swab tests turned negative. In other countries, asymptomatic cases are not included in the caseloads reported to WHO and other data repositories. In other countries, the asymptomatic caseload is estimated on the basis of sample surveys.
For estimating the fatality rate, the authors of the GoK report used total caseload including the asymptomatic persons. Since countries other than India do not include asymptomatic cases in the caseload, comparisons with other counties are impossible. (Moreover, asymptomatic persons are not sick, they are the ones who will run the show, when the pandemic will reach its acute stage, if does!)
The epidemic prevention and control works in Kerala were conducted as per textbook precision. All returnees from abroad and other states were systematically by the local level Asha workers, swab samples taken on the day of the first symptom. Swab samples of persons who had close contact with confirmed patients were also taken even before the appearance of symptoms. and admitted to designated hospitals immediately on receipt of a positive RT-PCR test result. There was an average delay of about 10 to 20 days between the first symptom and hospitalisation in China, Europe and USA.
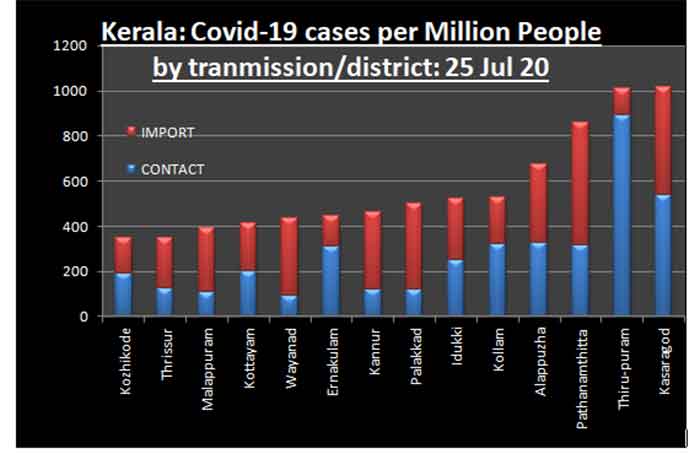
District-wise cases per million population by type of transmission
The current caseload can be broadly grouped into two based on the mode of transmission: – (a) Import- persons who returned to the State during May-July 2020 from other States and abroad and (b) Contact- those who were in the State before the first lockdown.
Graph 1 shows the rate per million population by mode of transmission and districts for Kerala. Rate for the entire state is 542 per million (281 by contact and 261 import). Kerala’s rate is lower than that of India, which is again one of the lowest rates in the world (See graph-3)
As of now, in comparison to other countries, Kerala as well as India are in a comfortable situation, both in terms of spread of the infection as well as death rate. See graph2 for cases and deaths per million population in Kerala, India and other major countries.
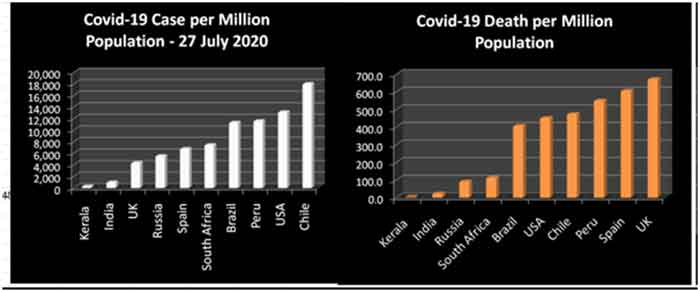
Graph- 2 Covid-19 Cases per million people – India and other Major countries – 27 Jul 2020
Caseload by transmission type and dates- 18 March – 25 July 2020
As of now (27 Jul 20), the pandemic in Kerala is 25 weeks old. Until the 7th week (ending 18 March 2020), the average new cases per day was less than 2. The daily numbers increased by about times during the next three weeks. From weeks 11 through 14, the daily accretion returned to single digit.
Data for 19 weeks) ending 18 March- 22 July 2020) is given in tab le 2. Graph 2 has data from 27 June to 25 July 2020.
Table 2: Average daily new cases by week and transmission type- Kerala as on 25 July 2020
| Week-end | Week No | Import | Contact | Both |
| 18-Mar-20 | 7 | 1.4 | 0 | 1.4 |
| 25-Mar-20 | 8 | 11.7 | 1.3 | 13.0 |
| 1-Apr-20 | 9 | 13.4 | 7.6 | 21.0 |
| 8-Apr-20 | 10 | 7.3 | 4 | 11.3 |
| 15-Apr-20 | 11 | 2.1 | 4 | 6.1 |
| 22-Apr-20 | 12 | 5.3 | 1.9 | 7.1 |
| 29-Apr-20 | 13 | 3.3 | 5 | 8.3 |
| 6-May-20 | 14 | 0.4 | 0.6 | 1.0 |
| 13-May-20 | 15 | 2.7 | 0.4 | 4.6 |
| 20-May-20 | 16 | 16.3 | 2.6 | 18.9 |
| 27-May-20 | 17 | 42.7 | 5.4 | 48.1 |
| 3-Jun-20 | 18 | 64.3 | 5.9 | 70.1 |
| 10-Jun-20 | 19 | 87.9 | 7.4 | 95.3 |
| 17-Jun-20 | 20 | 67.3 | 9.3 | 76.6 |
| 24-Jun-20 | 21 | 124.1 | 5.3 | 129.4 |
| 1-Jul-20 | 22 | 126.9 | 14.6 | 141.4 |
| 8-Jul-20 | 23 | 177.9 | 51.0 | 228.9 |
| 15-Jul-20 | 24 | 228.1 | 255.9 | 479.7 |
| 22-Jul-20 | 25 | 234.4 | 548.3 | 782.7 |
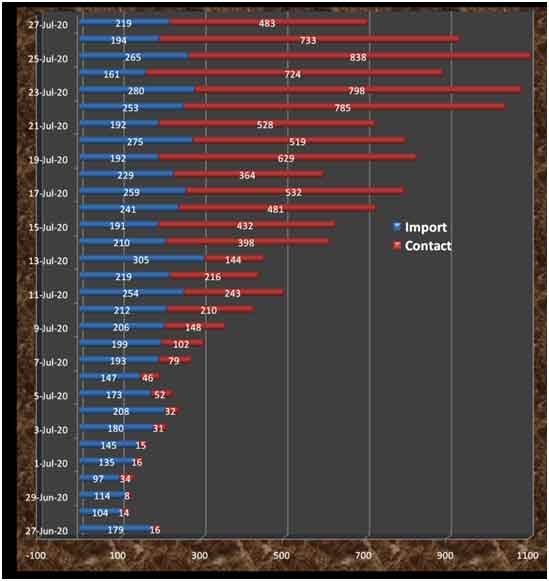
During the week-ending 08 July, the average number of new contact cases per day was 51. During the next week, the number shot up to 256 (5 times increase) and it further doubled during the 25th week.
Graph 3: Caseload by transmission type and dates- 27 June – 27 July 2020
Conclusion
Is the exponential increase of new cases since the second week of July natural or was it due to any human intervention. Incidentally, the news of gold smuggling surfaced on 06 July, followed by street protests all over the state. Many of them were not following the Covid-19 protocols of wearing masks and keeping social distance. We are already seeing a decline in the number of new contact cases on 26 and 27 July 2020. The total number of new contact case on 27 July 2020 is less than 60% of the new cases on 25 July 20. More data and detailed analysis is required for settling the issue.
Acknowledgement
The data was obtained from the following sources:
Government of Kerala dashboard: https://dashboard.kerala.gov.in/index.php,
Director of Health Services Daily Bulletin : http://dhs.kerala.gov.in/%e0%b4%a1%e0%b5%86%e0%b4%af%e0%b4%bf%e0%b4%b2%e0%b4%bf-%e0%b4%ac%e0%b5%81%e0%b4%b3%e0%b5%8d%e0%b4%b3%e0%b4%b1%e0%b5%8d%e0%b4%b1%e0%b4%bf%e0%b4%a8%e0%b5%8d%e2%80%8d/
Kerala COVID-19 Tracker, a group of volunteers based in Government College Kasargod: https://covid19kerala.info/
https://www.worldometers.info/coronavirus/
VT Padmanabhan is a researcher in health effects of radiation. He has led epidemiological investigations among people exposed to high radiation in Kerala. He has also studied the occupational radiation hazards among workers of Indian Rare Earths, genetic effects of children exposed to MIC gases in Bhopal, health hazards to workers in a viscose rayon unit in Madhyapradesh and reduction of birth weight of babies near a beverage bottling plant in Kerala. He has visited several contaminated sites in Belarus and Japan and had extensive interactions with the survivors.His papers have been published in International Journal of Health Services, Journal of American Medical Association, International Perspectives in Public Health, the Lancet and Economic and Political Weekly. He is a member of the European Commission on Radiation Risk, an independent body of experts appointed by the Green MEPs in Europe.
SIGN UP FOR COUNTERCURRENTS DAILY NEWSLETTER


