In this three part series, we take a look at the economic situation in the country, in early 2024, in the context of the claims being made by the Modi Government regarding the state of the economy.
In Part 1 of this article series, we take a look at the claims being made about India becoming a 5 trillion dollar economy within the next few years.
The GDP Conundrum
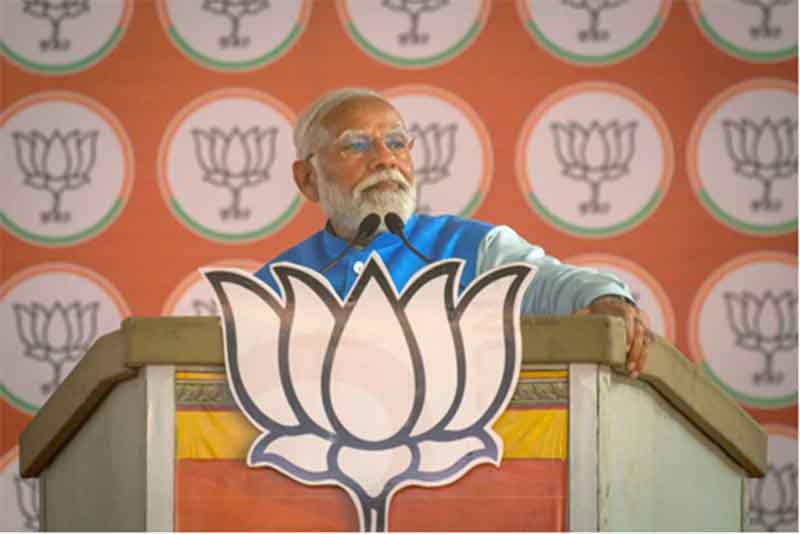
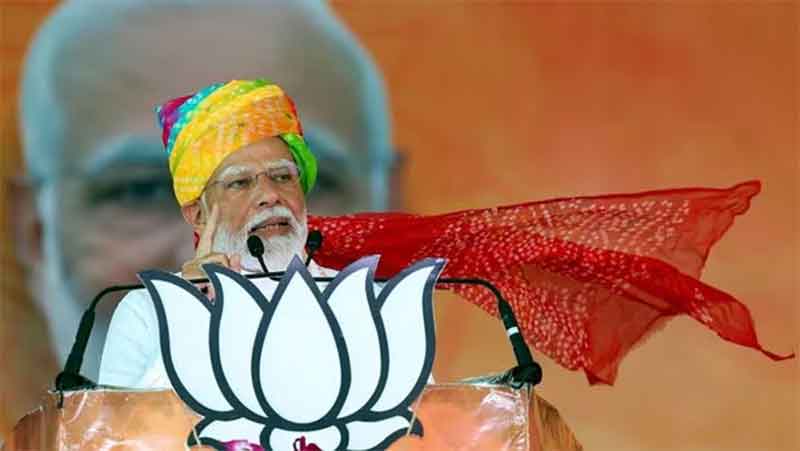
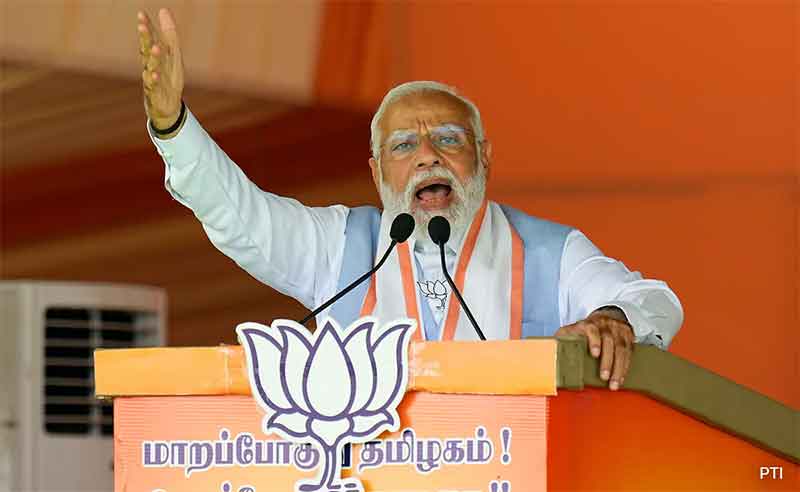
In 2019, Prime Minister Narendra Modi famously envisioned that India would become a $5 trillion economy by 2024–25. Because of the economic collapse of 2020–21, we are now expected to reach this target by 2027–28 or thereabout — according to our Finance Minister in a speech at the Vibrant Gujarat Summit in Gandhinagar in January this year.[1] The Prime Minister’s Yes-men-and-women have been competing with each other in making even grander claims, of India becoming a $10 trillion and a $20 trillion economy in the years and decades to come. NITI Aayog has made a triple jump, and come out with a draft vision document ‘Viksit Bharat @ 2047’ to make India a $30 trillion economy by 2047.
Modi’s friends too are excitedly chirping in unison. Business tycoon Gautam Adani has come up with this gem, “Following independence, it took us 58 years to get to our first trillion dollars of GDP, 12 years to get to the next trillion and just 5 years for the third trillion. I anticipate that within the next decade, India will start adding a trillion dollars to its GDP every 18 months. This puts us on track to be a $25–$30 trillion economy by 2050 …” Mukesh Ambani has gone one step further, and said that he expects India to become a $35 trillion economy by 2047.[2]
All these flunkeys are also gung-ho about India being the fifth largest economy in the world, and becoming the third largest economy in a few years.
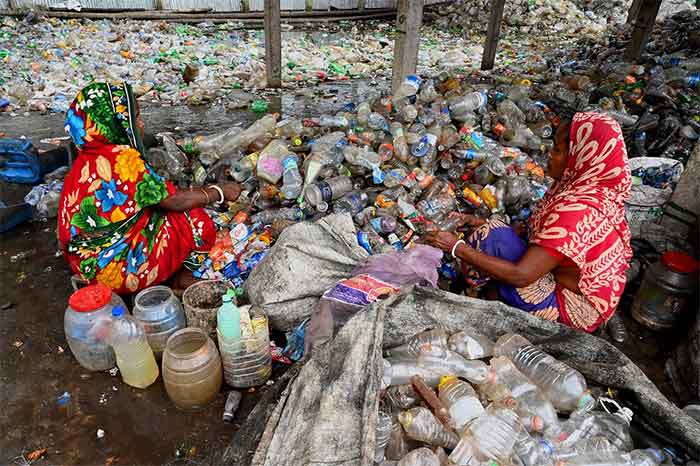
But in an economy with such extreme inequality — India is now among the most unequal countries in the world, with the top 1% controlling more wealth more than during the British colonial period, while the majority of the population lives on incomes among the lowest in the world — such overall figures have no meaning. The same IMF, which expects India to become a $5 trillion economy by 2026–27, also admits that India had the lowest per capita income amongst all large economies. In per capita terms, the Indian economy is at the 138th position in the world.[3] Being the fifth or the third largest world economy is no consolation to the marginalised.
This limitation of GDP data — that it does not reflect how well the ordinary people are doing — is now admitted even by some of the world’s leading economists like Joseph Stiglitz and Amartya Sen. In a study done for French President Nicolas Sarkozy in 2009, these economists called for the adoption of new tools to measure how well the economy is doing, that incorporate a broader concern for human welfare than just economic growth.[4] But let us for the moment keep this aside and consider the claims made by the Modi Government about how well the economy is doing.
In this year’s budget speech, the FM does not make any mention of the country’s projected growth rate for the coming year, or the expected growth rate for 2023–24. The Finance Ministry has not released any Economic Survey for this year, and instead released a booklet “The Indian Economy – A Review” that briefly takes stock of the state of the Indian economy, its journey in the last ten years and the outlook for the economy in coming years. While the earlier Economic Surveys generally adopted a critical approach towards the country’s economy, pointing out its shortcomings, this Review is more of a propaganda document, eulogising the Modi Government’s economic policies of the last 10 years. Regarding GDP growth, the Review claims that the structural reforms undertaken during the past 10 years of the Modi Government “have led to India emerging as the fastest growing economy among G20 economies. In 2023–24, as per current estimates, it is estimated to have grown 7.3 per cent on top of the 9.1 per cent (FY22) and 7.2 per cent (FY23) in the previous two years.” [5] Since then, the government has further upped the growth rate for this year to 7.6%.
The Modi Government’s passion for claiming India to be the fastest growing economy in the world is not new. It began making these claims during its first term itself. But there are several problems with the Modi Government’s estimates of GDP and GDP growth rates, which raise questions about the reliability of these figures.
Problem 1: Manipulation of Data
The biggest problem with these claims being made by the Modi Government is — it has no qualms about manipulating data to suit its political propaganda. For this, it has proactively destroyed India’s statistical system, which was once one of the best and most reliable in the developing world. It has curbed the independence of the National Statistical Commission, which was originally envisaged as an independent body of experts which would verify and supervise the collection, collation and dissemination of official data, and made it subservient to its wishes. It has pressurised the Central Statistical Organisation (CSO), the body that collects and disseminates data, which is run and staffed by professional economists and statisticians, to blatantly manipulate official data to glorify the economic record of the Modi Government. This manipulation began right from the very time the Modi Government came to power in 2014.[6] Let us take a brief look at Modi Government’s manipulation of the country’s GDP data over the past decade.
Soon after Modi Government assumed power in 2014, the CSO announced that it was changing the base year for all calculations to 2011–12 (from the earlier base year of 2004–05), as well as changing the methodology for calculating the GDP. This magically upped the GDP growth rate by 2 percentage points, making India the world’s fastest growing major economy. The following year (2016), the CSO released another set of estimates, further upping the growth rate figures for the BJP years.
Now, there is fundamentally nothing wrong with re-basing the GDP; this is periodically done. But this time, there were several reasons for doubting the new data series. To begin with, whenever the GDP is rebased, the “back series” is also released immediately, going back to at least a decade or more. This time, what was bewildering was that the CSO for three years did not publish the GDP growth figures for the years prior to 2011–12. Finally, in July 2018, a committee set up by the National Statistical Commission (NSC) presented its estimates of GDP back series based on the new methodology. But to the Modi Government’s dismay, the new back series showed that economic growth during the UPA years exceeded the growth during the BJP years (the new series calculated the average growth rate during the UPA years to be 8.0%, while the average growth rate during the 3 BJP years as per the new series was 7.6%). Despite the NSC being an autonomous body, the Modi Government forced the NSC to trash the report, and the government’s sycophantic statisticians burnt the midnight oil to come up with a new back series that showed a lower rate of growth during the UPA years as compared to the BJP years. (The new data now lowered the growth rate during the UPA years to 6.7%.) This was released to the press in November 2018 by the Niti Aayog vice-chairman — when actually the Niti Aayog has nothing to do with computation of GDP figures, and the data should have been released by the CSO. Clearly, the Niti Aayog had helped the CSO massage the GDP figures. And then, wonder of wonders, in 2019, just a day before the Modi Government released its last budget of its first term, the CSO further bumped up the growth rate data for the year 2016–17 to show that growth for the four BJP years was even higher than earlier projected, at 7.7% (see Table 1).[7]
Table 1: Modi Government’s Manipulation of GDP Figures
(GDP at constant prices, 2011–12 base) (%)
| 2005–06 | 2006–07 | 2007–08 | 2008–09 | 2009–10 | 2010–11 | 2011–12 | 2012–13 | 2013–14 | Average: 2005–06 to 13–14 | ||
| GDP Growth rate, July 2018 | UPA Years | 9.6 | 9.7 | 10.2 | 4.2 | 8.8 | 10.8 | 7 | 5.5 | 6.4 | 8 |
| GDP Growth rate, Nov 2018 | 7.9 | 8.1 | 7.7 | 3.1 | 7.9 | 8.5 | 5.2 | 5.5 | 6.4 | 6.7 | |
| 2014–15 | 2015–16 | 2016–17 | 2017–18 | Average: 2014–15 to 17–18 | |||||||
| GDP Growth rate, Nov 2018 | BJP Years | 7.4 | 8.2 | 7.1 | 7.6 | ||||||
| GDP Growth rate, 2019 | 7.4 | 8 | 8.2 | 7.2 | 7.7 |
There were rumblings of disbelief about the new figures. All reports from the ground indicated that the hastily announced demonetisation in November 2016 and then the badly designed GST in mid-2017 had devastated the economy, especially the informal sector. But the new official estimates claimed that India had grown at a whopping 8.2% in 2016–17, and 7.2% in 2017–18 (see Table 1). These figures were simply unbelievable!
Arvind Subramanian, who was the Modi Government’s Chief Economic Advisor from 2014 to 2018, let the cat out of the bag after resigning. In a working paper published in June 2019, he admitted that India’s GDP was overestimated by 2.5 percentage points per year for the post-2011 period, that is, for the five year period 2012–13 to 2016–17. Instead of the reported average growth of 6.9% for these five years, the GDP growth was more likely to be around 4.4%.[8]
There is a limit as to how much you can manipulate data. As the economic situation worsened during the Modi years, the CSO was forced to admit that the economy was slowing down: the GDP growth rate slowed down for 9 consecutive quarters to touch 3.1% for January–March 2020, and for 2019–20 as a whole, the growth rate fell to just 4%, an 11-year low (Table 2).[9]
Table 2: GDP Growth Rate Before the Pandemic, 2015–16 to 2019–20 (%)
| 2015–16 | 2016–17 | 2017–18 | 2018–19 | 2019–20 | Average | |
| GDP Growth Rate | 8 | 8.3 | 6.8 | 6.5 | 4 | 6.7 |
This means that the economy had begun sinking into recession even before the corona pandemic hit the economy.
After that, the pandemic struck. The Modi Government’s inept handling of the pandemic led to an unprecedented economic collapse. Official data admitted that the economy contracted by –7.7%.[10] India witnessed perhaps the sharpest absolute drop in GDP among the major economies of the world in 2020–21.[11]
With the lifting of the lockdown, the economy began to recover. Once again the Modi Government’s trumpeters began to proclaim that India’s post-pandemic growth rates are the highest among the major economies — the CSO estimates GDP growth to be 9.75% in 2021–22, 7% in 2022–23 and at 7.6% in 2023–24.
Several mainstream economists have questioned the reliability of the latest figures dished out by the CSO. For instance, in September 2023, Ashoka Mody, a professor of economics at Princeton University, wrote an article in a reputed international publication, accusing the Indian government of conducting a “branding and beautification” exercise on its GDP numbers to make them look better in the run-up to the G20 summit. The CSO had released data showing India’s GDP growth rate for the first quarter of 2023–24 to be 7.8%. Mody argued that the CSO had calculated India’s GDP growth on the basis of output or production data. But there was a huge discrepancy between this figure and the GDP measured on the basis of Expenditure (PFCE + GFCE + GFCF + Change in Stocks + Valuables + Imports + Exports). For the April–June quarter, expenditure had risen by only 1.4%. When the discrepancy is negligible, it can be ignored, but when the discrepancy is large, then the international best practice is to take both figures into consideration. For instance, the Bureau of Economic Analysis (BEA) of the USA uses an average of the two. If we use this methodology, then the Q1 2023–24 growth rate falls from the headline 7.8% to 4.5%.[12]
In early January 2024, the NSO released the First Advanced Statistics of National Income for 2023–24. In that, it projected the GVA growth to be 6.9% and GDP growth to be 7.3% for 2023–24. Less than 2 months later, in end-February 2024, it came out with Second Advance Estimates of National Income, 2023–24. In this data, the NSO revised the GDP growth rate upwards to 7.6%, while keeping the GVA growth rate to be the same — which makes the upward revision of GDP dubious. [13]
More recently, the well known economist and former Chief Statistician of India Pronab Sen has pointed out another important discrepancy in the data released by the NSO, which indicates that the GDP growth rate is overestimated. According to Sen, private consumption growth numbers correlate very closely with the GDP growth figure. If GDP growth is X percent then consumption growth can at most be 0.5 to 1 percentage points less than X. This means if GDP growth is estimated to be 7.6% for 2023–24, then consumption growth should be at least 6.6%. But official data shows consumption growth to be only about 3% (see Table 3). Sen argues that the only possible conclusion that can be drawn from the fact that the consumption growth rate is less than half of GDP growth is that GDP growth is overestimated.[14]
Table 3: GDP and PFCE, 2022–23 and 2023–24 (Rs. crore)
| 2022–23 1st RE (1) | 2023–24 SAE (2) | Growth rate (2 over 1), % | |
| GDP at Constant Prices | 1,60,71,429 | 1,72,90,281 | 7.6 |
| Private Final Consumption Expenditure | 93,23,825 | 96,05,526 | 3% |
Problem 2: Methodology Problems
The second problem with the GDP data relates to the methodology used by the CSO to calculate the GDP — it suffers from a serious infirmity.
The Indian economy consists of two broad sectors: the organised and the unorganised. The organised sector produces about 55% of the output, but employs only 6% of the workforce; the unorganised sector contributes to 94% of the employment and 45% of the output of the economy.[15] Of this, agriculture contributes to around 45% of the workforce and 14% of the GDP. The data for the organised sector are produced regularly every year, and so its contribution to the GDP can be accurately estimated. Of the unorganised sector, data for only agriculture is available. For the remaining unorganised sector, which has 99% of all production units and contributes to 31% of the GDP, data is collected only once in five years. In between these years, the unorganised sector’s contribution to the GDP is calculated using growth of the organised sector. The last such survey was carried out in 2015–16; after that, the Modi Government has not carried any such surveys, and also scrapped all other surveys that could have given us factual data about the state of the unorganised sector.[16]
Under normal conditions, the data for the organised sector can be used to estimate the contribution of the unorganised sector to the GDP. However, with the economy suffering two shocks in quick succession — first demonetisation, and then GST — this assumption was no longer valid. The unorganised sector declined sharply, while the organised sector did not. A 2018 survey by the All India Manufacturers’ Organisation, which represents over three hundred thousand units —including a large number of micro, small and medium enterprises — showed that the number of jobs in micro and small enterprises had declined by roughly a third since 2014. In medium-scale enterprises, about a quarter of jobs had been lost, and among traders the decline was over 40%.[17] A study by the Reserve Bank of India (RBI) too noted that the Micro, Small and Medium Enterprises (MSMEs) have been adversely hit by the Goods and Services Tax (GST) roll-out and Demonetisation.[18] This suggests that during the second half of 2016–17, after the implementation of demonetisation in November 2016, the growth rate of the unorganised sector had fallen to zero, and in 2017–18, after the implementation of GST, it had contracted by at least –10%, even by a conservative estimate. Combining these figures with the official GDP growth rate of 8.2% for 2016–17 and 7% for 2017–18 — both of which represent the growth rate of the organised sector only — the actual growth rate for 2016–17 works out to about 3.7%[19] and for 2017–18 only around 1%.[20] With the Modi Government taking no steps to revive crisis-ridden unorganised sector, while the CSO data admit that the economy had slowed down in 2018–19 to 6.5% and in 2019–20 to 3.9%, the actual growth rate must have been much lower.
And then, in 2020, the corona epidemic hit the economy. The Modi Government’s callous handling of the epidemic led to an unprecedented economic collapse, and figures released by the CSO showed an economic contraction of –23.9% during the first quarter of FY21, the worst in recorded history. But again, this data reflects only the decline of the organised sector. The unorganised sector, whose decline is not captured in the GDP data as discussed above, suffered an even worse collapse, as it was hit the hardest by the brutal lockdown. Professor Arun Kumar estimates that the unorganised sector probably declined by around 70–80% during the first quarter of FY21. Incorporating this figure into the GDP data, he calculates that the economy probably declined by –47% during April–June 2020, and not –23.9%. For the full financial year 2020–21, while the CSO estimates the contraction to be –7%, again this only represents the contraction of the organised sector. Factoring in the decline suffered by the unorganised sector, Professor Arun Kumar estimates the contraction to be a whopping –29%.[21]
Post-pandemic, the Modi Government has been gung-ho about the economy’s rate of growth being the highest among the major economies. But several data sets indicate that these figures represent the growth rate of the organised sector only, while the unorganised sector continues to flounder:
- Work demand under the Mahatma Gandhi National Rural Employment Guarantee Scheme (MGNREGS) continues to be more than the pre-pandemic level, and on a steady rise. As per official statistics, a total of 305.2 person days (one person working a normal shift) were generated in financial year 2023–24, which is 12 crore more person days than in 2022–23 and 40 crore more than the first pandemic year in 2019–20. This high demand for low wage MGNREGA work only means that the economic recovery has occurred primarily in sectors and activities which are not employment-intensive; while the employment intensive petty and small-scale sectors have been left out of the ambit of the recovery.[22]
- Labour Bureau data from 2014–15 to 2021–22 shows during these eight years, the growth rate of real wages was below 1% per year across the board for all three groups of workers — agricultural and non-agricultural workers, and construction workers. More recent wage data presented in Economic Survey 2022–23 shows that this pattern of stagnation has continued till the end of 2022.[23]
- PLFS data also show that real wages of casual workers and self-employed workers, who constitute more than 75% of the workforce, have stagnated over the period 2017–18 to 2021–22.[24]
The reason for this continuing crisis of the unorganised sector is that instead of providing some relief to the unorganised sector to help it recover, the Modi Government has used the crisis plaguing this sector to corporatise the economy.
This corroborates the views of economist Pronab Sen mentioned earlier, who has argued that the growth rate for 2023–24 is overestimated.
Problem 3: Data Deficiencies
This methodological problem in calculating the GDP is compounded by data deficiencies. Even for the organised sector, only limited data is available. For instance, the corporate sector data representing industry is available only for a few hundred firms. In the case of agriculture, it is assumed that targets set by the ministry are achieved. But that has not been the case in the last few years due to heat or late rains or inability of perishable crops to come to the market during the lockdown and demonetisation, so that it rotted in the fields and agricultural output declined while the government has assumed that it has increased.
Estimating Actual GDP of the Indian Economy
We can now make a rough estimate of what is the actual GDP in 2023–24. We make two estimates: one, based on the GDP growth rates estimated above; and two, after making generous relaxations in these GDP growth rates. The GDP for 2023–24 then works out to between Rs 97 lakh crore and Rs 125 lakh crore[25] — the former figure is 56% and the latter is 72% of the official GDP of Rs 173 lakh crore estimated by the Modi Government (at constant prices) for 2024.
Assuming that the ratio of GDP at current prices to GDP at constant prices remains the same, this means that the GDP at current prices is between Rs 165 and 213 lakh crore (as compared to the nominal GDP of Rs 294 lakh crore for 2023–24), implying that our GDP is overestimated by around 30–45%.
Chart: Official GDP and Actual GDP Estimates (Rs lakh crore)

Notes
1. “India to be $5 Trillion Economy by 2027–28: Finance Minister”, 11 January 2024, https://www.deccanherald.com.
2. M.G. Devasahayam, “India’s ‘Amrit Kaal’: Hunger, Inequity and a $30-Trillion Economy”, 2 December 2023, https://thewire.in.; “Nothing Can Stop India from Becoming $35 Trillion Economy, Says Mukesh Ambani”, 10 January 2024, https://www.indiatoday.in.
3. Amitabha Roychowdhury, “Multilateral Banks Debunk Govt Claims on India’s Growth Rate”, 9 May 2023, https://www.newsclick.in; Arun Kumar, “The Hollowness of the Modi Government’s Tall Claims and Self-Praise on Economy”, 18 August 2023, https://thewire.in.
4. We have discussed this greater detail in our booklet, “Is the Government Really Poor?”, Lokayat publication, available online at https://lokayat.org.in.
5. The Indian Economy – A Review, p. 5, Department of Economic Affairs, https://dea.gov.in.
6. For more on this, see: Jayati Ghosh, “Hindutva, Economic Neoliberalism and the Abuse of Economic Statistics in India”, South Asia Multidisciplinary Academic Journal, 2020, https://journals.openedition.org.
7. For July 2018 figures: “Simply Put: This Back Series, That Back Series”, November 30, 2018, https://indianexpress.com; For November 2018 figures: Press Note on National Accounts Statistics Back-Series (2004–05 to 2011–12), 28 November 2018, http://www.mospi.gov.in; For 2019 figures: Press Note on First Revised Estimates of National Income, Consumption Expenditure, Saving And Capital Formation for 2017–18, January 31, 2019, http://www.mospi.gov.in. We have discussed this manipulation in detail in a previous article in Janata Weekly: Neeraj Jain, “Modinomics = Falsonomics: Part I”, Janata Weekly, March 31, 2019, https://janataweekly.org.
8. Subramanian based his calculations on the July 2018 back series of the NSC committee. Arvind Subramanian, “India’s GDP Mis-estimation: Likelihood, Magnitudes, Mechanisms, and Implications”, CID Faculty Working Paper No. 354, June 2019, https://www.hks.harvard.edu.
9. Press Note on First Revised Estimates of National Income, Consumption Expenditure, Saving and Capital Formation for 2019–20, 29 January 2021, https://www.mospi.gov.in.
10. This is the first advanced estimate made in January 2021 (This was later modified to –5.8%): Press Note on First Advance Estimates of National Income 2020–21, 7 January 2021, https://www.mospi.gov.in.
11. Prabhat Patnaik, “The Current State of India’s Economy”, 24 April 2023, https://www.networkideas.org.
12. Ashoka Mody, “India’s Fake Growth Story”, 6 September 2023, https://www.project-syndicate.org.
13. “Multiple Data Rejigs Lift GDP Growth to 7.6%, with 8.4% Spurt in Q3”, 29 February 2024, https://www.thehindu.com.
14. M.K. Venu, “Sluggish Consumption Data Debunks PM Modi’s High GDP Growth Claims”, 5 March 2024, https://thewire.in.
15. According to Pronab Sen, economist and famed statistician who oversaw the 2011–12 re-basing of GDP as chairman of the National Statistical Commission (NSC), during the 2011–12 re-basing of the GDP series, the contribution of the unorganised sector was taken to be 47%. Cited in: Prasanna Mohanty, “Recession Reality Check: Do Quarterly GDP, Other Indicators Reflect the True State of Economy?”, 9 December 2019, https://www.businesstoday.in.
16. Arun Kumar, “The Gathering Storm”, 4 November 2019, https://caravanmagazine.in; Prasanna Mohanty, “Recession Reality Check: Do Quarterly GDP, Other Indicators Reflect the True State of Economy?”, 9 December 2019, https://www.businesstoday.in; Arun Kumar, “What Do We Really Know About India’s GDP?”, 4 January 2024, https://thewire.in.
17. Arun Kumar, “Falling Fortunes”, 30 January 2019, https://caravanmagazine.in.
18. “MSME Worst Hit by GST, Demonetisation, Says RBI Study”, 18 August 2018, https://www.business-standard.com.
19. Our estimate; we base ourselves on the growth rate calculated by Arvind Subramanian, and factor in the collapse of the unorganised sector and agriculture for the second half of the year.
20. Professor Arun Kumar’s estimate. For more on his estimate, see: Prasanna Mohanty, “Recession Reality Check: Do Quarterly GDP, Other Indicators Reflect the True State of Economy?”, 9 December 2019, https://www.businesstoday.in; Arun Kumar, “Falling Fortunes”, 30 January 2019, https://caravanmagazine.in.
21. Arun Kumar, “What the 23.9% Drop in Q1 GDP Tells – and Doesn’t Tell – Us About the Economy”, 2 September 2020, https://thewire.in; “State of Economy Far Worse Than Govt Admits, GDP Shrank by More Than What Govt Claims”, Arun Kumar interviewed by Karan Thapar, 30 January 2021, https://thewire.in.
22. “Rise in Demand for MGNREGS a ‘Living Monument’ of Govt. Failure, Says Jairam Ramesh”, The Hindu Bureau, 1 April 2024, https://www.thehindu.com.
23. Jean Dreze, “Wages are the Worry, Not Just Unemployment”, 13 April 2023, https://indianexpress.com. See also: C.P. Chandrasekhar, “GDP Estimates Fail to Adequately Capture Informal Sector”, 15 June 2023, https://frontline.thehindu.com.
24. State of Working India 2023, Centre for Sustainable Employment, Azim Premji University, https://publications.azimpremjiuniversity.edu.in.
25. For the first estimate, we have taken the growth rates for the years 2012–13 to 2016–17 to be those estimated by Arvind Subramanian; and for 2016–17 we have factored in the collapse of the unorganised sector; for 2017–18 we take Prof Arun Kumar’s estimate; for 2018–19, we assume a slight recovery in the unorganised sector; for 2019–20, since the economy is slowing down, we assume the unorganised sector too is slowing down; for 2020–21, we take Prof Arun Kumar’s estimate; and for 2021–22 and 2022–23, we assume a slight recovery in the unorganised sector; and for 2023–24, we take Pronab Sen’s estimate that the GDP growth should be at the most 1% above consumption growth; we have taken it to be 1.5% more.
For the more liberal calculation, we have taken the growth rates for the years 2012–13 to 2015–16 to be 2% less than the CSO figures (rather than the 2.5% estimated by Subramanian); for 2016–17 to 2022–23, we have taken the growth rates of the unorganised sector to be double the estimates made in the previous calculation; for 2020–21 we have taken the contraction to be –15%, half of what Prof Arun Kumar has estimated; and for 2023–24, we have taken the GDP growth rate to be slightly higher than that taken in the previous calculation.
…………………………………………………………………………………………………………………………………………….
About the author:
Neeraj Jain is a Btech in Electrical Engineering. He is a social-political activist with an activist group called Lokayat in Pune, and is also the Associate Editor of Janata Weekly, a weekly print magazine and blog published from Mumbai.
Email: [email protected].