Carbon Debt is simply the damage-related cost of greenhouse gas (GHG) pollution that if not addressed now will inescapably have to be paid by future generations. However GHG emissions continue to rise inexorably and there is no global program to draw down CO2 and other GHGs from the atmosphere. While young people are now vociferously demanding massive climate action, inescapable global Carbon Debt is $200- $250 trillion and increasing by $16 trillion each year.
Unlike Conventional Debt that can be variously expunged by bankruptcy, printing money or default, Carbon Debt is inescapable – thus, for example, national commitments to GHG pollution reduction made to the 2015 Paris Climate Conference amount to a temperature rise of over 3 degrees Centigrade (3C) , and unless huge sea walls are built Netherlands-style , coastal cities of the world housing hundreds of millions of people will be submerged by rising sea levels (notably in Asia), mega-delta agricultural lands vital for feeding Humanity will be subject to inundation and salinization, and low-lying Island States will cease to exist [1-3].
While outright, anti-science climate change denialism is politically entrenched in climate criminal Trump America and its climate criminal lackey Australia, most governments around the world are politically committed to effective climate change denialism through climate change inaction. That climate change inaction is most clearly quantitated in terms of Carbon Debt, but the very term has been white-washed out of public perception by US owned or subverted Mainstream media. Thus the Australian ABC (the taxpayer-funded Australian equivalent of the UK BBC) is self-assertedly “progressive” but a Search of the ABC for the term “Climate Debt” reveals zero (0) reportage. A Search of the self-assertedly “ethical” UK BBC for the term “Climate Debt” yields 9 items with none later than 2009, defining the term or quantifying global or national Carbon Debt.
Explanations for this extraordinary Mainstream media lying by omission over Carbon Debt can be variously advanced, ranging from entrenched mendacity by US- and corporate- subverted media to cognitive dissonance in the face of a worsening climate emergency. However I am confident in predicting that if governments do not take action on the world’s massive Carbon Debt then intergenerational justice action by the utterly betrayed and robbed young people of the world will make the present Extinction Rebellion climate demonstrations in London look like a proverbial Teddy Bear’s Picnic. A young people-led Climate Revolution (non-violent one hopes) is coming [4-8], but the horrendous numbers elicited in this analysis tell us that it is probably much too late.
Set out below are various approaches to estimating the world’s horrendous Carbon Debt and the numbingly gigantic annual increase in Carbon Debt. In considering these huge numbers, one must note that the global wealth was $317 trillion in 2018, an estimated $333 trillion in 2019, $350 trillion in 2020 and $399 in 2023 [9]. The aggregate world wealth in the global carbon economy is increasing at about $14 trillion per year [9], but the top 1% (the One Percenters who own half the wealth of the world ) have secured 82% of this wealth increase , while the poorest 3.7 billion of the world have secured zero [10].
- Requisite atmospheric CO2 draw-down from the present 407 ppm CO2 over the next decade will cost up to $12.7 to $24.9 trillion annually for various 342 to 280 ppm CO2 goals.
Professor James Hansen (of 96 Nobel Laureate Columbia University): “One ppm of CO2 is 2.12 billion tons of carbon or about 7.77 billion tons of CO2. Recently Keith et al. (2018) achieved a cost breakthrough in carbon capture, demonstrated with a pilot plant in Canada. Cost of carbon capture, not including the cost of transportation and storage of the CO2, is $113-232 per ton of CO2. Thus the cost of extracting 1 ppm of CO2 from the atmosphere is $878-1803 billion. In other words, the cost, in a single year, of closing the gap between reality and the IPCC scenario that limits climate change to +1.5°C is already about $1 trillion. And that is without the cost of transporting and storing the CO2, or consideration of whether there will be citizen objection to that transportation and storage. This annual cost will rise rapidly, unless there is a rapid slowdown in carbon emissions… cost of CO2 storage… has been estimated as $10-20/tCO2” [11].
Taking Professor Hansen’s data, and including his estimates of the cost of transport and storage of CO2, indicates that this “best so far” cost of atmospheric CO2 draw-down is $123-252/tCO2. Accordingly, the upper estimate of the cost of reducing the atmospheric CO2 by 1 ppm = 1 ppm x 7.77 Gton CO2/ppm x $252/ton CO2 = $1,958 billion. Using this upper estimate one can calculate the cost of CO2 draw-down to various targets.
(a) James Hansen has estimated a required CO2 draw-down to 342 ppm CO2 if the Earth’s energy imbalance is 1 W/m2 [11]. The upper estimate of the Carbon Debt for a transition from the present 407 ppm CO2 to 342 ppm CO2 is 65 ppm CO2 x $1,958 billion per ppm CO2 = $127.3 trillion or $12.7 trillion per year if we did this over 1 decade.
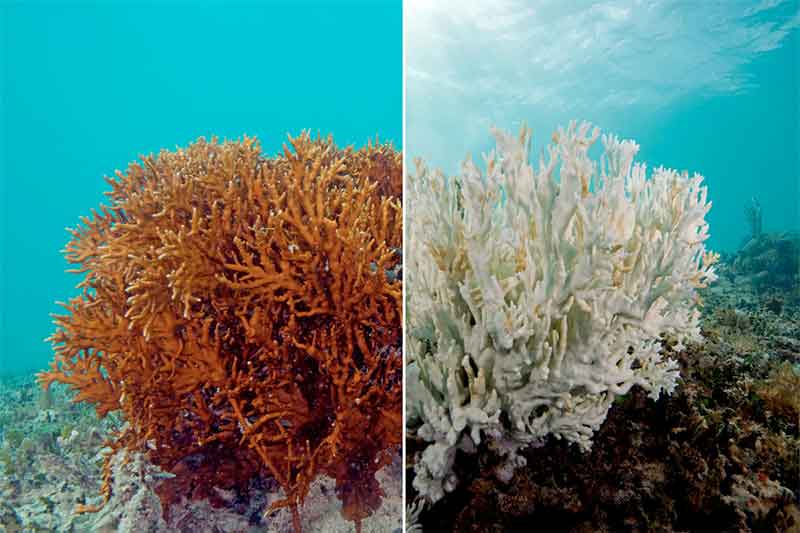
(b) The World’s top coral scientists have collectively that world coral reefs started dying when the atmospheric CO2 reached 320 ppm CO2 and that a CO2 draw-down to this level is required for sustainability of the world’s coral reefs [12, 13]. The upper estimate of the Carbon Debt for a transition from the present 407 ppm CO2 to 320 ppm CO2 is 87 ppm CO2 x $1,958 billion per ppm CO2 = $170.3 trillion or $17.0 trillion per year if we did this over 1 decade.
(c) Many scientists and science-informed activists demand a reduction of atmospheric CO2 to a safe and sustainable level of about 300 ppm CO2 [14, 15]. The upper estimate of the Carbon Debt for a transition from the present 407 ppmCO2 to 300 ppm CO2 is 107 ppm CO2 x $1,958 billion per ppm CO2 = $209.5 trillion or $21.0 trillion per year if we did this over 1 decade.
(d) Professor Hans Joachim Schellnhuber (director of the Potsdam Institute for Climate Impact Research, Germany) (2008): “Perhaps it will not matter whether we have 270 ppm or 320 ppm [CO2], but operating well outside the [historic] realm of carbon dioxide concentrations is risky as long as we have not fully understood the relevant feedback mechanisms” [280 ppm is the pre-industrial atmospheric CO2 concentration] [16]. The upper estimate of the Carbon Debt for a transition from the present 407 ppm CO2 to 280 ppm CO2 is 127 ppm CO2 x $1,958 billion per ppm CO2 = $248.7.0 trillion or $24.9 trillion per year if we did this over 1 decade.
- Upper estimate of $16 trillion for annual increase in Carbon Debt taking all greenhouse gases (GHGs) into account.
Unfortunately there is presently no significant global effort to draw down atmospheric CO2, and indeed global greenhouse gas (GHG) pollution is remorselessly increasing and with it a relentlessly increasing Carbon Debt as set out below. In the last year the atmospheric CO2 as measured by the US National Oceanic and Atmospheric Administration (NOAA) at Mauna Loa, Hawaii, rose by 2.6 ppm CO2 [17]. The upper estimate of the annual increase in Carbon Debt associated with this annual increase in CO2 is 2.6 ppm CO2 per year x $1,958 billion per ppm CO2 = $5.1 trillion.
However there are GHGs other than CO2 that contribute to global warming, notably methane (CH4) and nitrous oxide (N2O). CH4 derives from anaerobic bacterial metabolism in the rumens of ruminant livestock (it is voided by eructation or belching) and in anaerobic swamps or urban tips . N2O derives from oxidation of nitrogenous agricultural fertilizers and also derives from nitrogen (N2) oxidation associated with high temperature fossil fuel (coal, gas and oil) combustion. The Global Warming Potential (GWP) of CH4 relative to the same mass of CO2 on a 20 year time frame and with aerosol effects considered is 105 times that of CO2 (1) but is 21 on a 100 year time frame [18-21]. The GWP of N2O on a 20 year time frame relative to the same mass of CO2 is 289 [21].
The combined global warming potential of atmospheric GHGs is expressed as CO2-equivalent (CO2-e). Thus while the atmospheric CO2 is presently 407 ppm , the combined GHGs amount to 527 ppm CO2-e [22]. According to Professor Ronald Prinn (Professor of Atmospheric Science in the 93 Nobel Laureate Massachusetts Institute of Technology (MIT) Department of Earth, Atmospheric and Planetary Sciences), when the CO2 was 400 ppm in 2013, the CO2-e was 478 ppm [23], this suggesting a 2019 level of 486 CO2-e. World Bank analysts have re-assessed the annual global GHG emissions taking livestock, land use and a 20-year time frame GWP of methane of 72 into account – this analysis revised the annual GHG pollution upwards from 41.8 Gt CO2-e to 63.8 Gt CO2-e [24].
Assuming that CH4 and N2O can be removed from the atmosphere for the same cost as removal of CO2, then the resultant upper estimated cost of $252 per ton CO2-e (see section 1 above) translates to an annual increase in Carbon Debt of 63.8 Gt CO2-e per year x $252 per ton CO2-e = $16.1 trillion per year.
This upper estimate of the annual cost of $16.1 trillion per year for GHG pollution is similar to the present annual wealth generation of $14 trillion per year [9]. Indeed this equivalence should not be surprising – in our presently carbon pollution-based economy, productivity can be measured either in the net dollar worth of production or in GHGs produced in the process. One notes that the world’s annual GDP (nominal) is about $85 trillion [25, 26]
- Using the damage-related cost of carbon pollution of $200 per tonne CO2 yields a $11.6 trillion annual increase in Carbon Debt.
Dr Chris Hope (Judge Business School, University of Cambridge) has estimated the damage-related cost of carbon pollution (2011): “If the best current scientific and economic evidence is to be believed, and climate change could be a real and serious problem , the appropriate response is to institute today a climate change tax equal to the mean estimate of the damage caused by a tonne of CO2 emissions . The raw calculations from the default PAGE09 model suggest the tax should be about $100 per tonne of CO2 in the EU. But correcting for the limited time horizon of the model , and bringing the calculations forward to 2102 [2012] , in year 2012 dollars , brings the suggested tax up to about $150 per tonne of CO2 . There are good arguments for setting the initial tax at about $250 per tonne of CO2 in the US , while starting off at a much lower level , may be $15 per tonne of CO2 ,in the poorest regions of the world ,all in the year 2012 , in year 2012 dollars” [27].
If we use the $200 per tonne CO2 average of the damage-related $250 per tonne CO2 (US) and $150 per tonne CO2 (EU), we can determine the annual increase in Carbon Debt as 63.8 billion ton CO2-e per year x $200 per tonne CO2-e x 0.907 tonne / ton = $11.6 trillion per year, similar to the upper estimate of $16 trillion estimated in section 2 above based on the cost of removing GHGs from the atmosphere [11].
4. The $16 trillion annual Carbon Debt increase, Value of a Statistical Life (VSL) and the $13.5 trillion annual cost of the Global Avoidable Mortality Holocaust of 15 million deaths from deprivation annually.
There is a largely ignored Global Avoidable Mortality Holocaust in which currently 15 million people die avoidably each year from deprivation and deprivation-exacerbated disease in the Developing World (minus China) [28]. Avoidable mortality from deprivation (avoidable deaths, excess mortality, excess deaths, premature deaths, untimely deaths, deaths that should not have happened) can be simply estimated from UN Population Division demographic data as the difference between the actual deaths in a country and deaths expected for a peaceful, decently-run country with the same demographics . For impoverished, high birth-rate, Developing countries the baseline mortality rate is about 4 deaths per 1,000 of population per year [29]. For such impoverished countries the avoidable mortality is about 1.4 times the under-5 infant deaths, the latter information being readily obtained from the UN Population Division [29].
This carnage is happening on Spaceship Earth with the flight deck under the control of the 10% richest people who have about 90% of the wealth of the World and who in turn are controlled by One Percenters who own about 50% of the wealth of the World. An annual global wealth tax of about 4% would yield $16 trillion annually (as assessed in 2014) [30] and enable raising all countries to an annual per capita GDP equivalent to the presently circa $8,500 per person per year of China and Cuba, countries for which annual avoidable mortality is zero (0) [28, 29, 31, 32]. This is a feasible option for stopping the Global Avoidable Mortality Holocaust. Indeed a progressive annual wealth tax ranging up to 10% for the richest has been proposed for democracy and economic sustainability reasons by French economist Professor Thomas Piketty in his important book “Capital in the Twenty-First Century” [33, 34]. Indeed Islam has mandated a 2.5% annual wealth tax (zakkat) for about 1,400 years [35].
For Americans the risk avoidance-based Value of a Statistical Life (VSL) is about $9 million [36], and for people in the South with GDP per capitas of the order of 10 times lower than for the North [31] we could roughly estimate a 10 times lower VSL of $0.9 million. Accordingly, committing to a 4% annual wealth tax realizing $16 trillion (in 2014) to save 15 million lives annually would be balanced by VSL-based “savings” of 15 million people per year x $0.9 million per person = $13.5 trillion per year.
The profligate $16 trillion annual increase in Carbon Debt (see section 2) is numerically the same as the 4% annual wealth tax realizing $16 trillion (in 2014) that could abolish the Global Avoidable Mortality Holocaust in which currently 15 million people die avoidably each year from deprivation at a VSL-based cost of $13.5 trillion per year.
The top 10 countries in terms of their percentages of total global personal wealth as determined by Allianz, are as follows: (1) United States (41.6%), (2) China (10.5%), (3) Japan (8.9%), (4) U.K. (5.6%), (5) Germany (3.9%), (6) France (3.5%), (7) Canada (3.0%), (8) Italy (2.9%), (9) Australia (2.0%), and (10) South Korea (1.6%) – the rest account for 16.5% of the world’s wealth [37]. The total accumulated wealth of the world in 2019 is $333 trillion and the average wealth of Americans in 2018 was $63,100 , this being similar to the GDP (nominal) per capita for Americans of $60,000 [26]. A global 4% annual wealth tax would presently garner $13.3 trillion per year, similar to the $15.7 trillion per year for a decade to get back to the coral reef-based “canary in the mine” required 320 ppm CO2 (see section 1).
However Democratic presidential candidate Senator Elizabeth Warren’s recent “radical” wealth tax proposal – a 2% annual tax on household net worth on all dollars above $50 million and an additional 1% surtax for those with above $1 billion in income – would only garner an utterly paltry $0.275 trillion each year over 10 years from an America with 4.3% of the world’s population, 41.6% of the world’s wealth [38], 14.75% of world GHG pollution (minus land use) of 45.367 Gt CO2-e in 2014 [39] i.e. 6.67 Gt CO2-e and corresponding to an annual Carbon Debt (minus land use) of at least $1.7 trillion per year. Of course one must recognize that her ignorant opponent, Donald Trump, dismissed climate change as a “hoax” in the 2016 presidential campaign.
- The total Carbon Debt of the world is a daunting circa $200-$250 trillion.
The upper estimate of the Carbon Debt for a transition from the present 407 ppm CO2 back to the pre-Industrial Revolution level of 280 ppm CO2 is 127 ppm CO2 x $1,958 billion per ppm CO2 = $248.7.0 trillion [11], a sum that is 78% of the 2018 accumulated wealth of the world of $317 trillion in 2018 [9], and if paid off over 1 decade would require payment at $24.9 trillion per year.
Alternatively, the historical Carbon Debt of a country can be measured by the amount of greenhouse gas (GHG) it has introduced into the atmosphere since the start of the Industrial Revolution in the mid-18th century. Thus the total Carbon Debt of the world (in Giga tonnes CO2-e i.e. billions of tonnes CO2-e) from 1751-2019 (including CO2 that has gone into the oceans) is about 346 Gt CO2-e (1750-2008) [40] + 638 Gt CO2-e (2009-2019) [24] = 984 Gt CO2-e. Assuming a damage-related Carbon Price of $200 per tonne CO2-equivalent [27], this corresponds to a Carbon Debt of $197 trillion, about two-thirds of the total wealth of the world ($317 trillion in 2018) and 2.3 times the world’s total annual GDP ($85 trillion in 2018). Payment of this debt over 1 decade would require payment at $19.7 trillion per year.
6. Total and annual Carbon Debt of the US, Australia, China and India.
The US has a huge GHG pollution of 5.14 Gtonnes CO2-e per year and of about 51.4 Gtonnes CO2-e (for the period 2009-2019) [44] with an historical GHG pollution of 99.1 Gtonnes CO2-e (1750-2008) [40, 41], for a total Carbon Debt of 51.4 + 99.1 = 150.5 Gtonnes CO2-e that corresponds (at $200 per tonne CO2-e) to a Carbon Debt of $30.1 trillion that is increasing at $1.0 trillion per year (6.3% of the world’s $16 trillion per year). However a revised estimate of US GHG pollution taking land use and CH4 into account [45, 46] is 41 tonnes CO2-e per person per year for the US, or 19.6 Gt (based on a present population of 327 million) and hence an annual Carbon Debt increase of $2.0 trillion per year (12.5% of the world’s $16 trillion per year increase in Carbon Debt). This revised estimate is more consistent with the US (population 327 million, 4.3% of that of the world ) being responsible for 24.1 % of the world’s GDP in a global carbon economy (world population 7,530 billion) [31].
My own country, Australia, that is among world leaders in 14 GHG pollution-related areas [42, 43] has a Carbon Debt of US$5.1 trillion (A$7 trillion) that is increasing at US$400 billion (A$556 billion) per year and at US$40,000 (A$56,000) per head per year for under-30 year old Australians [41]. However a revised estimate of Australian annual GHG pollution taking land use and CH4 into account [44, 45] is 52.9 tonnes CO2-e per person per year, or (based on a population of 25 million) 1.32 Gt CO2-e and an annual increase in Carbon Debt of $0.26 trillion per year (1.7 % of the world’s $16 trillion per year Carbon Debt increase). Taking Australia’s huge coal and gas exports into account, Australia’s annual GHG pollution is 116 tonnes CO2-e per person per year or (with a population of 25 million) 2.9 Gt CO2-e and an annual Carbon Debt increase of $0.6 trillion (3.8% of the world’s $16 trillion per year increase in Carbon Debt, noting that Australia’s population is only 0.3% of the world’s population and contributes 1.4 % of world GDP [31]).
The revised annual GHG emission of China (population 1,390 million) taking land use and CH4 into account, is 7.4 tonnes CO2-e per person per year (2013), and 10.3 Gt CO2-e in total per year, with this corresponding to an annual increase in Carbon Debt of $2.1 trillion per year (13.1% of the world’s annual Carbon Debt increase , noting that China has 18.5% of the world’s population and contributes 12.2% of world GDP).
India does even better than China on a per capita basis. The revised annual GHG emission of India (population 1,340 million) taking land use and CH4 into account, is 2.1 t CO2-e per person per year (2013), and 2.8 Gt CO2-e in total per year with this corresponding to an annual increase in Carbon Debt of $ 0.56 trillion per year (3.5% of the world’s annual Carbon Debt increase, noting that India has 17.8% of the world’s population and contributes 2.6% of world GDP).
From the above it is apparent that on a per capita basis the US and Australia contribute disproportionately and vastly more to the annual increase in global Carbon Debt than China that (contributes its fair share) and India that contributes much less to the human world’s suicide mission.
- VSL and the $7 trillion annual cost of 7 million annual deaths from carbon-based air pollution and 1 million annual deaths from climate change.
About 7 million people die each year from the effects of pollutants from carbon fuel burning [47]. It has been estimated that 0.4 million people die each year from climate change [48, 49], but this is surely an underestimate because each year 15 million people die avoidably from deprivation in the impoverished tropical and sub-tropical South that is disproportionately impacted by climate change [28]. Accordingly, one can reasonably posit that annual climate change deaths are of the order of 1 million. Adopting a risk avoidance-based Value of a Statistical Life (VSL) of $0.9 million per person for impoverished countries, one can see that 8 million annual deaths from carbon fuel burning and climate change correspond to 8 million deaths x $0.9 million per person = $7.2 trillion. Unfortunately the Climate Genocide that presently kills about 1 million people per year is worsening. Several leading climate scientists have estimated that as few as 0.5 billion people will survive this century if man-made climate change is not requisitely addressed., with this translating to about 10 billion climate deaths this century and an extremely academic Carbon Debt of $9,000 trillion [2].
- $200 per tonne CO2-e Carbon Tax can help drive rapid transit to zero emissions and thence massive negative emissions.
If we accept that “all men are created equal” then it is a no-brainer that polluters should fully pay for the social and environmental cost of their pollution. Indeed Pope Francis has unequivocally stated that the social and environmental cost of pollution should be “fully borne” by the polluters. In stark contrast to the terracidal One Percenters, Pope Francis recognizes a looming climate catastrophe and millions of premature deaths from carbon burning pollutants, demands massive decarbonisation and conversion to renewables starting without delay in the next few years, rejects Carbon Trading as a dishonest ploy, advocates a “fully borne” Carbon Price (Carbon Tax) on polluters, proposes boycotts of polluters, condemns loss of biodiversity and advises intergenerational solidarity [50, 51].Two expert estimates of a required Carbon Tax (Carbon Price) are considered above, to whit $200 per tonne CO2-e from climate economist Dr Chris Hope of 118 Nobel Laureate Cambridge University [27], and up to $252 per ton CO2-e ($229 per tonne CO2-e) from Professor James Hansen of 96 Nobel Laureate Columbia University [11]. Nevertheless the politically dominant, climate criminal One Percenters who control half the wealth of the world have responded to such expert opinion with massively funded climate change denialism [52] and thence variously with fall-back positions of grossly insufficient, corrupt and counterproductive Carbon Trading schemes to preserve the present suicidal Carbon Economy [53]. A $200 per tonne CO2-e Carbon Tax can help drive rapid transit to zero emissions and thence massive required negative carbon emissions as set out above.
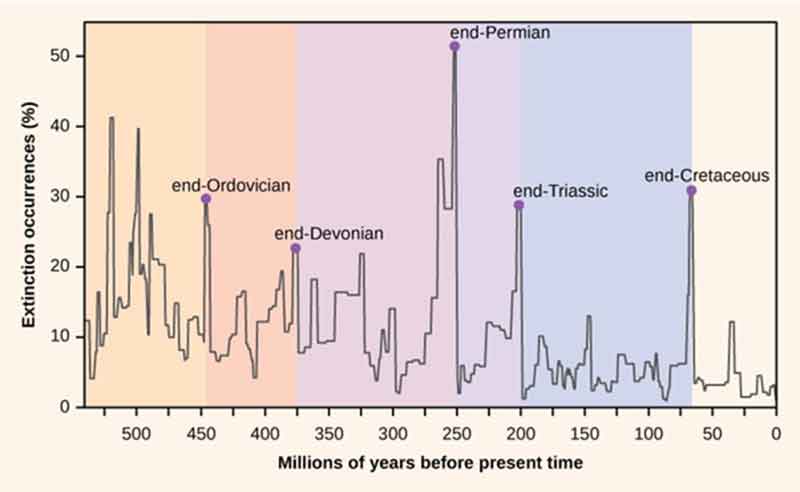
8. Any species is priceless – Anthropocene Era mass extinctions imply infinite Carbon Debt.
We must not destroy what we cannot replace – .any species is accordingly priceless. Yet mass extinctions are now occurring at such a level to have prompted scientists to call the present era the Anthropocene Era. The extinction rates are now 100-1,000 above normal. [54-60]. Thus, for example, coral reefs are hugely complex, multi-species ecosystems and the IPCC has recently projected a further 70-90% decline of coral reefs at global warming of +1.5C versus more than a 99% loss at +2C [56-58]. Anthropocene Era mass extinctions imply infinite Carbon Debt. That said, environmental economists have assessed the economic value of nature as of the same order as the annual world GDP. Dr Andrew Balmford and colleagues have stated (2002): “On the eve of the World Summit on Sustainable Development, it is timely to assess progress over the 10 years since its predecessor in Rio de Janeiro. Loss and degradation of remaining natural habitats has continued largely unabated. However, evidence has been accumulating that such systems generate marked economic benefits, which the available data suggest exceed those obtained from continued habitat conversion. We estimate that the overall benefit:cost ratio of an effective global program for the conservation of remaining wild nature is at least 100:1” [61].
9. Impossibly high Carbon Debt from unlimited Australian coal and gas exports ($353 trillion) and adumbrated Arctic CH4 release ($1,050 trillion).
Climate criminal Australia (0.3% of the world’s population) has a bipartisan policy – fervently adhered to by the present Liberal Party-National Party Coalition Government and the Labor Party Opposition that are collectively known as the Lib-Labs – of unlimited coal, gas an iron exports. In contrast, the science-informed Australian Greens want to achieve 100% renewable energy and cease all thermal coal exports by 2030 [62]. However it is estimated that feasible exploitation of Australia’s presently discovered conventional and unconventional gas resources would generate 61.5 billion tonnes of CO2-e and combustion of Australia’s huge coal resource potential of 1 trillion tonnes of coal would be an estimated 692.7 Gt CO2 (from brown coal) plus 1,073.9 Gt CO2 (from black coal), for a total of 1,766.6 Gt CO2, with this corresponding to a Carbon Debt of 1.7666 trillion tonnes CO2 x $200 per tonne CO2 = $353 trillion (similar to the accumulated global wealth of $350 trillion in 2020 [9]). Australia has always been a deeply racist country [64, 65], but this takes racism and exceptionalism to an extraordinary, genocidal and indeed terracidal level.
It gets worse. Professor Peter Wadhams (professor of Ocean Physics, and Head of the Polar Ocean Physics Group in the Department of Applied Mathematics and Theoretical Physics, 118-Nobel-Laureate University of Cambridge, UK) and colleagues on the threat of a 50Gt methane release from the East Siberian Arctic Shelf (2013): “Economic time bomb. As the amount of Arctic sea ice declines at an unprecedented rate, the thawing of offshore permafrost releases methane. A 50-gigatonne (Gt) reservoir of methane, stored in the form of hydrates, exists on the East Siberian Arctic Shelf. It is likely to be emitted as the seabed warms, either steadily over 50 years or suddenly” [66]. The Global Warming Potential (GWP) of CH4 on a 20 year time frame and with aerosol impacts included is 105 relative to CO2 (1), and this 50 Gt CH4 release corresponds to 50 Gt CH4 x 105 t CO2-e/ t CH4 = 5,250 Gt CO2-e , which in turn corresponds to a Carbon Debt (at $200 per tonne CO2-e) of $1,050 trillion or 3 times greater than the accumulated wealth of whole world.
Final comments.
The world already has an inescapable Carbon Debt of $200-250 trillion that – instead of being urgently reduced by massive atmospheric CO2 draw-down – is relentlessly increasing at about $16 trillion per year. In a domestic household budget setting this would be utter lunacy – in a global setting it is mass suicide of humanity. This utterly disastrous present scenario means that a catastrophic plus 2C temperature rise is evidently unavoidable. However we are obliged to do everything we can to make the future “less bad” for future generations. A London wall mural attributed to the famed street artist Banksy declares: “From this moment despair ends and tactics begin” [67]. The young have no choice but to revolt (non-violently of course) – as exampled by the present Extinction Rebellion by young people in London [4, 5] – against the destruction of the Biosphere (speciescide, ecocide, omnicide, and terracide).
Decent people must oppose the neoliberal Gadarene rush to global suicide by (a) informing everyone they can, and (b) urging and applying Boycotts, Divestment and Sanctions (BDS) against all people, politicians, parties, collectives, corporations and countries disproportionately involved in the worsening climate emergency, climate genocide and Biosphere destruction. There is no Planet B and there must be zero tolerance for the neoliberal, genocidal and terracidal climate criminals. In climate criminal Australia that is among world leaders in GHG pollution, Biosphere destruction and climate change inaction, decent people will utterly reject the climate criminal Coalition Government, vote 1 Green and put the Coalition and its extremist associates last.
References.
[1]. Josh Holder, Niko Commenda and Jonathan Watts, “The three-degree world: the cities that will be drowned by global warming”, Guardian, 3 November 2017: https://www.theguardian.com/cities/ng-interactive/2017/nov/03/three-degree-world-cities-drowned-global-warming .
[2]. “Climate Genocide”: https://sites.google.com/site/climategenocide/ .
[3. Pacific Islands Development Forum, “Suva Declaration on Climate Change”, 4 September 2015: http://pacificidf.org/wp-content/uploads/2013/06/PACIFIC-ISLAND-DEVELOPMENT-FORUM-SUVA-DECLARATION-ON-CLIMATE-CHANGE.v2.pdf .
[4]. “Extinction Rebellion”: London climate protest “ending on Thursday””, BBC, 24 April 2019: https://www.bbc.com/news/uk-england-london-48044056 .
[5]. “Climate Revolution Now”: https://sites.google.com/site/300orgsite/climate-revolution .
[6]. “Climate Justice & Intergenerational Equity”: https://sites.google.com/site/300orgsite/climate-justice .
[7]. “Science & economics experts: Carbon Tax needed NOT Carbon Trading”: https://sites.google.com/site/300orgsite/sciennce-economics-experts-carbon-tax-needed-not-carbon-trading/ .
[8]. “Stop climate crime”: https://sites.google.com/site/300orgsite/stop-climate-crime .
[9]. Credit Suisse, “Global Wealth Report 2018”: https://www.credit-suisse.com/corporate/en/research/research-institute/global-wealth-report.html .
[10]. Oxfam, “Richest 1 percent bagged 82 percent of wealth created last year – poorest half of humanity got nothing” , 22 January 2018: https://www.oxfam.org/en/pressroom/pressreleases/2018-01-22/richest-1-percent-bagged-82-percent-wealth-created-last-year .
[11]. James Hansen, “Climate change in a nutshell: the gathering storm”, Columbia University, 18 December 2018: http://www.columbia.edu/~jeh1/mailings/2018/20181206_Nutshell.pdf .
[12]. Output of the technical working group meeting, The Royal Society, London, 6th July, 2009, “The Coral Reef Crisis: scientific justification for critical CO2 threshold levels of less than 350ppm”: http://static.zsl.org/files/statement-of-the-coral-reef-crisis-working-group-890.pdf .
[13]. J.E.N. Veron, O. Hoegh-Guldberg, T.M. Lenton, J.M. Lough, D.O. Obura, P. Pearce-Kelly, C.R.C. Sheppard, M. Spalding, M.G. Stafford-Smith and A.D. Rogers, “The coral reef crisis: the critical importance of <350 ppm CO2”, Marine Pollution Bulletin, vol. 58, (10), October 2009, 1428-1436: http://www.sciencedirect.com/science?_ob=ArticleURL&_udi=B6V6N-4X9NKG7-3&_user=10&_rdoc=1&_fmt=&_orig=search&_sort=d&_docanchor=&view=c&_searchStrId=1072337698&_rerunOrigin=google&_acct=C000050221&_version=1&_urlVersion=0&_userid=10&md5=6858c5ff7172f9355068393496a5b35d .
[14]. 300.org: . https://sites.google.com/site/300orgsite/300-org .
[15]. “300.org – return atmosphere CO2 to 300 ppm CO2”: https://sites.google.com/site/300orgsite/300-org—return-atmosphere-co2-to-300-ppm .
[16]. Professor Hans Joachim Schellnhuber quoted by David Adam, “Roll back time to safeguard climate, expert warns”, Guardian, 15 September 2008 : http://www.guardian.co.uk/environment/2008/sep/15/climatechange.carbonemissions ).
[17]. US National Oceanic and Atmospheric Administration (NOAA), “Trends in atmospheric carbon dioxide”: https://www.esrl.noaa.gov/gmd/ccgg/trends/ .
[18]. “Gas is not clean energy”: https://sites.google.com/site/gasisnotcleanenergy/home .
[19]. Drew T. Shindell , Greg Faluvegi, Dorothy M. Koch , Gavin A. Schmidt , Nadine Unger and Susanne E. Bauer , “Improved Attribution of Climate Forcing to Emissions”, Science, 30 October 2009:
Vol. 326 no. 5953 pp. 716-718: http://www.sciencemag.org/content/326/5953/716 .
[20]. Shindell et al (2009), Fig.2: http://www.sciencemag.org/content/326/5953/716.figures-only .
[21]. “2011 climate change course”: https://sites.google.com/site/300orgsite/2011-climate-change-course .
[22]. “Carbon dioxide equivalent”, Wikipedia: https://en.wikipedia.org/wiki/Carbon_dioxide_equivalent .
[23]. “400 ppm CO2? Add other GHGs, and its equivalent to 478”, Oceans at MIT, 6 June 2013: http://oceans.mit.edu/featured-stories/5-questions-mits-ron-prinn-400-ppm-threshold.html .
[24]. Robert Goodland and Jeff Anfang. “Livestock and climate change. What if the key actors in climate change are … cows, pigs and chickens?”, World Watch, November/December 2009: https://pdfs.semanticscholar.org/6704/c7a0777c82357704d82b9ae8007c1197cb07.pdf?_ga=2.187734888.1597394103.1556059730-1006954717.1556059730 .
[25]. “The world’s top 10 largest economies”, Focus Economics, 2019: https://www.focus-economics.com/blog/the-largest-economies-in-the-world .
[26]. “List of countries by GDP (nominal)”, Wikipedia: https://en.wikipedia.org/wiki/List_of_countries_by_GDP_(nominal) .
[27]. Chris Hope, “How high should climate change taxes be?”, Working Paper Series, Judge Business School, University of Cambridge, 9.2011: http://www.jbs.cam.ac.uk/fileadmin/user_upload/research/workingpapers/wp1109.pdf .
[28]. Gideon Polya, “Body Count. Global avoidable mortality since 1950” that includes an avoidable mortality-related history of every country since Neolithic times and is now available for free perusal on the web: http://globalbodycount.blogspot.com/ .
[29]. UN Population Division, World Population Prospects, 2013 Revision: http://esa.un.org/unpd/wpp/unpp/panel_population.htm .
[30]. Gideon Polya, “4 % Annual Global Wealth Tax To Stop The 17 Million Deaths Annually”, Countercurrents, 27 June, 2014: https://countercurrents.org/polya270614.htm .
[31]. “List of countries by GDP (nominal) per capita”, Wikipedia: https://en.wikipedia.org/wiki/List_of_countries_by_GDP_(nominal)_per_capita .
[32]. “List of countries by population”, Wikipedia : http://en.wikipedia.org/wiki/List_of_countries_by_population .
[33]. Thomas Piketty, “Capital in the Twenty-First Century”, Harvard University Press, 2014.
[34]. Gideon Polya, “Key Book Review: “Capital In The Twenty-First Century” by Thomas Piketty”, Countercurrents, 1 July, 2014: https://www.countercurrents.org/polya010714.htm .
[35]. “1% ON 1%: one percent annual wealth tax on One Percenters” website ( https://sites.google.com/site/300orgsite/1-on-1 .
[36]. Timothy Taylor, “Value of a statistical life. 9.1 million?”, Conversable Economist, 22 October 2013: http://conversableeconomist.blogspot.com.au/2013/10/value-of-statistical-life-91-million.html .
[37]. Erik Sherman, “America is the richest, and most unequal, country”, Fortune, 30 September 2015: http://fortune.com/2015/09/30/america-wealth-inequality/ .
[38]. David Dayen, “Elizabeth Warren proposes annual wealth tax on ultra-millionaires”, The Intercept, 25 January 2019: https://theintercept.com/2019/01/24/elizabeth-warren-proposes-annual-wealth-tax-on-ultra-millionaires/ .
[39]. “List of countries by greenhouse gas emissions”, Wikipedia: https://en.wikipedia.org/wiki/List_of_countries_by_greenhouse_gas_emissions .
[40]. James Hansen, “Letter to PM Kevin Rudd by Dr James Hansen”, 2008: http://www.aussmc.org.au/documents/Hansen2008LetterToKevinRudd_000.pdf
[41]. “Carbon Debt Carbon Credit”: https://sites.google.com/site/carbondebtcarboncredit/ .
[42]. Gideon Polya, “Pro-coal Australia & Trump America Reject Dire IPCC Report & Declare War on Terra”, Countercurrents, 17 October 2018: https://countercurrents.org/2018/10/17/pro-coal-australia-trump-america-reject-dire-ipcc-report-declare-war-on-terra/ .
[43]. Gideon Polya, “Offences of Pentecostal Christian Scott Morrison, PM after Australia’s fourth PM-removing coup in 8 years”, Countercurrents, 18 September 2019: https://countercurrents.org/2018/09/18/offences-of-pentecostal-christian-scott-morrison-pm-after-australias-fourth-pm-removing-coup-in-8-years/ .
[44]. “Greenhouse gas emissions by the United States”, Wikipedia: https://en.wikipedia.org/wiki/Greenhouse_gas_emissions_by_the_United_States .
[45]. Gideon Polya, “Revised Annual Per Capita Greenhouse Gas Pollution For All Countries – What Is Your Country Doing?”, Countercurrents, 6 January, 2016: http://www.countercurrents.org/polya060116.htm .
[46]. Gideon Polya, “Exposing And Thence Punishing Worst Polluter Nations Via Weighted Annual Per Capita Greenhouse Gas Pollution Scores”, Countercurrents, 19 March, 2016: https://countercurrents.org/polya190316.htm .
[47]. “Nuclear weapons ban, end poverty and reverse climate change”: https://sites.google.com/site/300orgsite/nuclear-weapons-ban .
[48]. DARA, “Climate Vulnerability Monitor. A guide to the cold calculus of a hot planet”, 2012, Executive Summary pp2-3: http://daraint.org/climate-vulnerability-monitor/climate-vulnerability-monitor-2012/ .
[49]. DARA report quoted by Reuters, ”100 mln to die by 2030 if world fails to act on climate”, 28 September 2012: http://in.reuters.com/article/2012/09/26/climate-inaction-idINDEE88P05P20120926 .
[50]. Pope Francis , Encyclical Letter “Laudato si”, 2015: http://w2.vatican.va/content/francesco/en/encyclicals/documents/papa-francesco_20150524_enciclica-laudato-si.html .
[51]. Gideon Polya, “Green Left Pope Francis Demands Climate Action “Without Delay” To Prevent Climate “Catastrophe””, Countercurrents, 10 August, 2015: https://countercurrents.org/polya100815.htm .
[52]. Richard Hil and Gideon Polya, “The silencing of the climate emergency, and what we should do about it”, New Matilda, 5 March 2019: https://newmatilda.com/2019/03/05/silencing-climate-emergency/ .
[53]. Gideon Polya, “Experts: Carbon Tax needed and NOT Cap-and-Trade Emission Trading Scheme (ETS)”, Yarra Valley Climate Action Group”: https://sites.google.com/site/yarravalleyclimateactiongroup/carbon-tax-needed-not-cap-and-trade-emission-trading-scheme-ets .
[54]. William J. Ripple et al., 15,364 signatories from 184 countries, “World scientists’ warning to Humanity: a second notice”, Bioscience, 13 November 2017: https://academic.oup.com/bioscience/advance-article/doi/10.1093/biosci/bix125/4605229 .
[55]. Gideon Polya, “Over 15,000 scientists issue dire warning to humanity on catastrophic climate change and biodiversity loss” ”, Countercurrents, 20 November 2017: https://countercurrents.org/2017/11/20/over-15000-scientists-issue-dire-warning-to-humanity-on-catastrophic-climate-change-and-biodiversity-loss/ .
[56]. IPCC, “Global warming of 1.5 °C”, 8 October 2018: http://www.ipcc.ch/report/sr15/ .
[57]. IPCC, “Global warming of 1.5 °C. Summary for Policymakers”, 8 October 2018: http://report.ipcc.ch/sr15/pdf/sr15_spm_final.pdf .
[58]. Gideon Polya, “IPCC +1.5C avoidance report – effectively too late but stop coal burning for “less bad” catastrophes”, Countercurrents, 12 October 2018: https://countercurrents.org/2018/10/12/ipcc-1-5c-avoidance-report-effectively-too-late-but-stop-coal-burning-for-less-bad-catastrophes/ ,
[59]. Andrew Glikson, “The IPCC’s final warnings of extreme global warming”, Countercurrents, 10 October 2018: https://countercurrents.org/2018/10/10/the-ipccs-final-warnings-of-extreme-global-warming/ .
[60]. Phillip S. Levin and Donald A. Levin, “The real biodiversity crisis”, Macroscope, January-February 2002: http://www.soc.duke.edu/~pmorgan/levin&levin.2002.the_real_biodiversity_crisis.html .
[61]. A. Balmford, A. Bruner, P. Cooper, R. Costanza, S. Farber, R. E. Green, M. Jenkins, P. Jefferiss, V. Jessamy, J. Madden, K. Munro, N. Myers, S. Naeem, J. Paavola, M. Rayment, S. Trumper and R. K. Turner “ Economic reasons for conserving wild nature”, Science 297: 950-953, 2002: http://www.sciencemag.org/cgi/content/abstract/297/5583/950 .
[62]. Katharine Murphy, “Greens set 2030 cut-off for coal exports and coal-fired power stations”, Guardian, 28 March 2019: https://www.theguardian.com/australia-news/2019/mar/28/greens-set-2030-cut-off-for-coal-exports-and-coal-fired-power-stations .
[63]. Gideon Polya, “Australia ‘s Huge Coal, Gas & Iron Ore Exports Threaten Planet”, Countercurrents, 15 May 2012: http://www.countercurrents.org/polya150512.htm .
[64]. “Aboriginal Genocide”: https://sites.google.com/site/aboriginalgenocide/ .
[65]. Gideon Polya, “As UK Lackeys Or US Lackeys Australians Have Invaded 85 Countries (British 193, French 80, US 70)”, Countercurrents, 9 February, 2015: http://www.countercurrents.org/polya090215.htm .
[66]. “Methane Bomb Threat”: https://sites.google.com/site/methanebombthreat/ .
[67]. Lanre Bakare, “London Extinction Rebellion mural is a Banksy, says expert” , Guardian, 26 April 2019: https://www.theguardian.com/artanddesign/2019/apr/26/london-extinction-rebellion-mural-is-a-banksy-says-expert .
Dr Gideon Polya taught science students at a major Australian university for 4 decades. He published some 130 works in a 5 decade scientific career, most recently a huge pharmacological reference text “Biochemical Targets of Plant Bioactive Compounds” (CRC Press/Taylor & Francis, New York & London , 2003). He has published “Body Count. Global avoidable mortality since 1950” (G.M. Polya, Melbourne, 2007: http://globalbodycount.blogspot.com/ ); see also his contributions “Australian complicity in Iraq mass mortality” in “Lies, Deep Fries & Statistics” (edited by Robyn Williams, ABC Books, Sydney, 2007: http://www.abc.net.au/radionational/programs/ockhamsrazor/australian-complicity-in-iraq-mass-mortality/3369002#transcript
) and “Ongoing Palestinian Genocide” in “The Plight of the Palestinians (edited by William Cook, Palgrave Macmillan, London, 2010: http://mwcnews.net/focus/analysis/4047-the-plight-of-the-palestinians.html ). He has published a revised and updated 2008 version of his 1998 book “Jane Austen and the Black Hole of British History” (see: http://janeaustenand.blogspot.com/ ) as biofuel-, globalization- and climate-driven global food price increases threaten a greater famine catastrophe than the man-made famine in British-ruled India that killed 6-7 million Indians in the “forgotten” World War 2 Bengal Famine (see recent BBC broadcast involving Dr Polya, Economics Nobel Laureate Professor Amartya Sen and others: http://www.open.edu/openlearn/history-the-arts/history/social-economic-history/listen-the-bengal-famine ; Gideon Polya: https://sites.google.com/site/drgideonpolya/home ; Gideon Polya Writing: https://sites.google.com/site/gideonpolyawriting/ ; Gideon Polya, Wikipedia: https://en.wikipedia.org/wiki/Gideon_Polya ) . When words fail one can say it in pictures – for images of Gideon Polya’s huge paintings for the Planet, Peace, Mother and Child see: http://sites.google.com/site/artforpeaceplanetmotherchild/ and http://www.flickr.com/photos/gideonpolya/ .