In this three part series, we take a look at the economic situation in the country, in early 2024, in the context of the claims being made by the Modi Government regarding the state of the economy. This is the third and concluding part of this series.
In Part 1 of our economic survey, we examined the veracity of the tall claims being made by the FM and official economists and other mainstream intellectuals about India’s GDP growth rate. In Part 2, we examined the magnitude of the unemployment crisis gripping the country, in the context of the latest figures released by the Modi Government that show unemployment to be at very low levels.[1] In this article, we take a look at India’s poverty levels, and the hunger and malnutrition situation in the country.
Modi Government’s Latest Claim on Poverty Reduction
With 2024 Lok Sabha elections approaching, the Niti Aayog has been making strenous attempts to show that a huge reduction in poverty has taken place during the past 10 years of the Modi Government. Rather than playing the role of a think tank that offers critical advice to the government, it seems to have become a cheerleader of the Modi government.
On February 24, the government released the broad findings of the All India Household Consumption Expenditure Survey (HCES) carried out between August 2022 and July 2023. Immediately the next day, on February 25, 2024, the chief executive officer of Niti Aayog B.V.R. Subrahmanyam made a fantastic claim that the HCES 2022–23 data reveals that poverty ratio in India had fallen below 5%. His claim was based on the fact that the per capita consumption expenditures of only 5% of the population in 2022–23 fell below the poverty lines for that year for rural and urban India.[2]
There are several problems with this claim. Firstly, there is no current poverty line determined by Niti Aayog unlike the erstwhile Planning Commission. In fact, the whole 27-page HCES fact-sheet remains silent on poverty estimation. If there is no poverty line, then how has the Niti Aayog chief determined that the level of poverty in the country has fallen to below 5%?[3]
B.V.R. Subrahmanyam probably deduced the poverty line for 2022–23 by updating, on the basis of consumer price indices, the poverty line suggested for 2011–12 by the Tendulkar committee.[4] Even if we keep aside the issue that the consumer price indices have serious underestimation biases, the HCES 2022–23 report clearly points out that the survey has been conducted on different lines from all earlier surveys, because of which its results are not comparable with earlier results. Then how is the Niti Aayog chief comparing HCES 2011–12 with HCES 2022–23?[5]
And finally, there are several problems with the poverty line proposed by the Tendulkar committee. The Tendulkar committee had not based its 2011–12 poverty lines on any objective criteria, such as minimum calorie intake, or the price of a minimum necessary basket of goods; it had simply made some arbitrary decisions regarding what these lines should be (more on this below).[6]
Therefore, the ‘5% below poverty line’ estimation of the Niti Aayog has little meaning, it is only Modi Government propaganda before the Lok Sabha elections.
Manufacturing a Poverty Index
The above claim by the Niti Aayog came close on the heels of another claim made by it in January 2024 — that poverty in India had sharply declined during the Modi years, from 29.17% of the population in 2013–14 to 11.28% in 2022–23. It made this claim in a discussion paper, ‘Multidimensional Poverty in India since 2005–06: A Discussion Paper’, released on January 15. In this paper, the Niti Aayog, in association with the UNDP, came out with a new measure of poverty, the National Multidimensional Poverty Index (NMPI), on the basis of which it claimed that about 24.82 crore people had been lifted out of poverty in the nine years to 2022–23.[7]
While this claim made the headlines in the godi media, what was missed in this hype was that not only had the Niti Aayog and the UNDP had given a totally new definition of poverty, which was vastly different from what is usually meant by the term, this new definition was neither theoretically robust nor statistically well-founded.
India began studying poverty in the early 1970s. Till recently, India’s statistical system was considered to be among the best in the world, and set standards for the rest of the world. India had a very robust and efficient system of estimating poverty in the country. It measured poverty on the basis of a threshold level of consumption, that is, spending of a household on a basket of goods — households spending below this threshold, called the poverty line, were considered poor. Within this, nutrition, that is, calorie intake, was taken as the basic criterion for measuring poverty. That is because for a country like India, at least for the poorer sections of society, if calorie intake falls, then it can only mean the family’s real income is worsening (it is only the richest sections that seek to reduce calorie intake to reduce ‘overconsumption’). On the basis of this understanding, India’s Planning Commission defined the poverty line as that particular level of total spending per capita on all goods and services, whose food spending part satisfied the nutrition level of 2200 calories of energy intake per day in rural India, and 2100 per day in urban areas. India’s statistical organisations estimated household expenditures on the basis of large sample size surveys called the Household Consumer Expenditure Surveys. These surveys were conducted by the National Sample Survey Office (NSSO) once every five years.[8]
NMPI has redefined this sensible definition of poverty and completely removed the element of nutrition from it, which till now formed the basis of all discussions of poverty. It takes a number of indicators and assigns them specific weights to arrive at a composite measure of what it calls multi-dimensional poverty. It uses 12 indicators: three related to Health (nutrition, child and adolescent mortality, maternal health), two to Education (years of schooling, school attendance), and seven Standard of Living indicators (cooking fuel, sanitation, drinking water, electricity, housing, assets, and bank accounts). And it comes to the conclusion that with regards to these indicators, the situation in the country has considerably improved over the 9 years to 2022–23.[9]
There are two important problems with this assertion by the Niti Aayog.
Problem One: Philosophical Problem
The first is the very concept of poverty as defined by the Niti Aayog and UNDP.
In any society that is developing, all the indices used by Niti Aayog–UNDP to measure poverty would generally show an improvement: the death-rate for children under eighteen drops; peer pressure and aspirations make parents send their children to school (especially if school attendance entitles a child to free mid-day meals); completing at least six years of schooling becomes quite common, even when children drop out of school later; and so on.
To put it differently, the Niti Aayog measure, which is supposed to reflect what it calls “multi-dimensional poverty”, makes decline in poverty virtually synonymous with “development”. If the country is “developing”, then poverty reduction must be taking place. On the basis of this definition, there would be no poor persons at all in the developed countries!
It is undeniable that “development” is occurring in India, and substantially under the aegis of the state. But poverty is not related to the mere occurrence of “development”, but with the question of who bears the cost of development, whether the working people or the rich. For instance, it is related to the question — whether the government, even while spending a few lakh crores on providing free rations to people, is reducing its overall social sector spending that would lead to a fall in people’s consumption. Therefore, for measuring poverty, it is important to determine whether on the whole the family is experiencing a decline in its living standards or not. And the best measure of this is — the family’s food consumption (since whenever the family’s budget gets stretched it usually cuts back on its food consumption). This is the rationale for taking nutrition as the basic criterion for estimating poverty. And this is what India’s statistical system used to measure, to determine the incidence of poverty in the country. But the Niti Aayog–UNDP measure does not take this into consideration in its measure of poverty.
Of course, Niti Aayog officials would argue that they are not totally ignoring undernutrition; one of their 12 indices is related to nutrition. But actually, their nutrition indicator does not measure nutritional deprivation; it measures the body mass index (BMI), which does not actually measure nutritional status. Here too, the NMPI is only concerned with BMI falling below a certain threshold, namely 18.5 kg/m2; it makes that the sole criterion of assessing such deprivation. It is elementary science that a person may be seriously undernourished and underweight, and yet their BMI may be above this threshold.[10]
Problem Two: Methodological Problem
The second problem with NMPI is: even if we accept the Niti Aayog’s above definition of poverty, even then, the very methodology adopted by the Niti Aayog for making its calculations of its poverty indicators is problematic. It takes data for the pre-Covid period for indicators like schooling and people’s health, assumes that Covid had no impact on these indicators, and without any data assumes that in the post-pandemic period the improvement in these indicators has continued at the same rate as the pre-Covid period — as if Covid had never occurred. That defies logic. During Covid, children lost two years of school. That is likely to affect their learning even after they returned to school post-pandemic. And yet, the NMPI totally ignores this. All three health indicators (nutrition, child and adolescent mortality, maternal health) were all adversely impacted by Covid. And yet, the authors of Niti Aayog’s NMPI have no qualms about ignoring the long term health impacts of the Covid shock to human health. They also have no qualms also about claiming that India’s poorest states (Uttar Pradesh, Bihar, Madhya Pradesh) had the best NMPI improvement, despite being the worst affected Covid states.[11]
Actually, it is doubtful if the Niti Aayog has based its NMPI on any factual data. Most of the NMPI indicators depend for their improvement on increasing government expenditure on the social sectors. The country’s economy totally collapsed during the Covid pandemic due to the Modi Government’s callous handling of the pandemic and the brutal lockdown imposed. The relief package given by the Modi Government was among the lowest in the world. Post-pandemic too, the Modi Government has not increased its social sector expenditures to help the poorer sections of society improve their standard of living. As we have calculated and shown in a previous article on the Modi Government’s budget for last year (2023–24):
The Modi Government’s expenditure on social services has significantly reduced every year since 2020–21, even in nominal terms. The estimated social sector expenditure for 2023–24 is less than that for 2020–21 by more than 20%! But this figure does not reflect the true extent of the cut made by the Modi Government in its social sector outlay. As a share of the total budget expenditure, the social sector budget outlay for the coming financial year (2023–24) is less than that for 2020–21 by as much as 40%; and as a percentage of the GDP, it is less by nearly half![12]
Despite these huge cuts, the Niti Aayog is claiming that the NMPI indicators have improved post-Covid in FY22 and FY23. In fact, the Niti Aayog claims that poverty indicators improved in the country even during the pandemic years, 2020–21. It claims that between 2015–16 and 2019–21, the proportion of population in multidimensional poverty reduced from 24.85% to 14.96% (see Chart 1 – it is a reproduction of the Chart given in the NMPI document). This means that, at the level of projected population in 2021, about 13.6 crore persons escaped poverty between 2015–16 and 2019–21.[13] That is an amazing assertion! It is as if the pandemic never occurred, everything was normal in the years 2019–21, and there was no economic collapse.
Chart 1: Percentage of People Below the Poverty Line (NMPI Estimate)

The noted economist Santosh Mehrotra is constrained to observe:
“Unfortunately, manufacturing evidence has been rather systematic in the last several years. In fact, the whole purpose of making NMPI the poverty indicator for India, while consumption expenditure surveys were not done for eight years from 2014 to 2022, is part of a political strategy…. The newest fabrication of a multidimensional poverty estimate by Niti Aayog is yet another effort to create a narrative in the run up to Lok Sabha elections 2024.”[14]
The Junked HCES Report of 2017–18
In this entire drum-beating about the results of the new poverty index (NMPI) framed by the Niti Aayog, what is forgotten is that the Modi Government framed this poverty index after junking the Household Consumer Expenditure Survey (HCES) conducted during 2017–18. This HCES is the most important and large scale survey conducted by the NSSO to collect information on the consumption spending patterns of households across the country, in both urban and rural areas. It has been conducted every five years without a break since 1973–74, and no government has ever tried to manipulate or suppress its findings. The Modi Government is the first government to suppress its findings.
The Ministry of Statistics and Programme Implementation (MoSPI) in a press statement issued on 15 November 2018 stated that it was not releasing the results of the HCES 2017–18 due to “data quality issues”. It claimed that it had found concerns with the survey’s figures and had referred them to a committee of experts, that had “noted the discrepancies and came out with several recommendations including refinement in the survey methodology and improving the data quality aspects on a concurrent basis.”[15] The government did not release the expert panel’s report; a request by Pramit Bhattacharya (a noted journalist) to obtain a copy of that expert panel’s report under the RTI Act was turned down by MoSPI, citing the “sensitivity” of the matter.[16]
But a few days later, the Business Standard reported, quoting an unidentified official, that the expert panel had not found “any issues related to data collection and data validation” in the 2017–18 report! Not only had it not recommended junking the report, it had in fact approved the report for release in July 2019 itself. The panel was set up under the leadership of NSO director general and National Statistical Commission member G.C. Manna and had members from the NSO and the Central Statistics Office. [17] In other words, the government was blithely lying.
In any case, as the Mint reported citing several of India’s top statisticians (such as P.C. Mohanan, former chairman of National Sample Survey Office), in any survey there would be data quality issues. But that can be no reason for suppressing the survey results — at the most, such issues help in improving future surveys. Likewise, discrepancies between the results of different data sets have existed for long, but again that cannot be a reason to suppress the survey report. A landmark study had in fact opined that there was no reason to privilege one data set over the other. A group of 201 economists from around the globe also issued a statement protesting the suppression of the report and seeking the release of the raw underlying data, so that it may be discussed and debated.[18]
Why did the government junk the HCES 2017–18 report? This became clear when the Business Standard published a leaked copy of the report. The report’s findings were startling. The leaked data showed that over the period 2011–12 to 2017–18, the average amount of money spent by an Indian in a month [called ‘monthly per capita consumption expenditure’ or (MPCE)] had fallen from Rs 1,501 in 2011–12 to Rs 1,446 in 2017–18 — a decline of 3.7% in six years. The decline was primarily because of rural areas, where consumer spending fell by 8.8%. The figure rose by 2% for urban areas. It is the first time the MPCE had dropped in the past four decades.[19]
The HCES 2017–18 also showed a rise in rural poverty as compared to the previous survey of 2011–12. The proportion of rural population not able to access 2200 calories per person per day, which was the original benchmark actually applied by the Indian Planning Commission for estimating rural poverty, had increased from 68% in 2011–12 to over 80% in 2017–18. The proportion of urban population below the urban poverty line (proportion of urban population not able to access 2100 calories per person per day) had marginally decreased from 65% to 60% over this period.[20] Taking the two together, clearly the poverty ratio in 2017–18 was significantly higher than in 2011–12, given the much higher weight of rural India in the total.[21] Combining the rural and urban figures, we can assume that in 2017–18, at least 70% of the country’s population was living below the original Planning Commission poverty line.
That’s huge. No wonder the BJP Government at the Centre, headed by Prime Minister Narendra Modi who is so concerned about his self-image that it borders on narcissism, decided to scrap HCES 2017–18 altogether.
Labour Bureau’s Fifth Annual Employment–Unemployment Survey
The above figures may appear to be unbelievable for those blown away by the Modi Government propaganda of India being on the way to becoming an economic powerhouse. But these figures closely match another reliable and official dataset on the condition of the people in the country. That is the Labour Bureau’s Fifth Annual Employment–Unemployment Survey released in September 2016 (as mentioned earlier, subsequent surveys have been scrapped, so this is the only dataset we have).
A study based on this survey data of 2016 found that of the total workforce in the country (see Table 1):
- 43.4% people earned less than Rs 5,000 per month; and
- 84.1% people earned less than Rs 10,000 per month.[22]
Table 1: Types of Employment and Monthly Earnings, 2015–16 (in %)
| Self- employed | Wage/Salary Earners | Contract Workers | Casual Labourers | Total | |
| % of Workforce | 46.6 | 17.0 | 3.7 | 32.8 | 100 |
| Monthly Earnings | As % of total employment | ||||
| Less than Rs 5,000 | 41.3 | 18.7 | 38.5 | 59.3 | 43.4 |
| Less than Rs 10,000 | 84.9 | 57.2 | 86.7 | 96.3 | 84.1 |
Less than 20% women work in the female workforce (we have discussed this in Part 2 of this article series), which means that in most families, there must be only one bread earner. Therefore we can assume that this data reflects the monthly earnings of most families in the country.
That was survey data for 2015–16. Over the next two years, due to the Modi Government’s assault on the informal sector, the condition of the poor definitely did not improve. The poor were devastated first by demonetisation, and then the anti-poor GST. Therefore, the real wages of workers must not have seen any significant increase over the period 2016–18.
This is borne out by Labour Bureau data for the period 2014–15 to 2021–22. Based on this data, the RBI in its latest Handbook of Statistics on Indian States has given annual wage estimates for general agricultural labourers, construction workers, and non-agricultural labourers. Economist Jean Dreze has converted these nominal wage figures into real wages using the Consumer Price Index for Agricultural Labourers (CPIAL). The results are startling. They show that during these eight years, the growth rate of real wages was below 1% per year across the board for all three groups of workers — agricultural and non-agricultural workers, and construction workers.[23] That means those earning Rs 10,000 per month would have been earning at the most Rs 10,200 in 2017–18 (in real terms).
The renowned economist Utsa Patnaik has estimated the poverty line for 2017–18 from the NSSO HCES survey results of that year. She estimates it to be Rs 70 for rural India. For a family of four persons, this amounts to Rs 8,400 per month.[24] This was therefore the rural poverty line in that year. The urban poverty line would be higher. But let us take Rs 8,400 per month as the poverty line for 2017–18 for both rural and urban areas.
If 84% of the workers were earning less than Rs 10,200 per month, we can conclude that at least 65–70% of the country’s population must have been living below the poverty line of Rs 8,400 per month in 2017–18.
Both HCES 2017–18 and the Labour Bureau’s EUS 2015–16 thus yield the same result, that around 70% of the country’s population was living below the poverty line in 2017–18.
Anoop Satpathy Committee Recommendations
In January 2018, the Ministry of Labour and Employment set up an expert committee under the Chairmanship of Dr. Anoop Satpathy (Fellow, the V. V. Giri National Labour Institute, NOIDA), with members from the ILO and the Wage Cell of the ministry, to determine the methodology for fixing the national minimum wage, which may become a baseline minimum wage in India covering all workers. The committee submitted its report in early 2019. It proposed a wage such that the expenditure on minimum recommended food intake, essential non-food items (namely clothing, fuel and light, house rent, education, medical, footwear, and transport) and other non-food items for the wage earner and their dependents can be met. The recommendation was Rs 375 per day for rural areas (Rs 9,750 per month) and Rs 430 for urban areas (Rs 11,180 per month) as of July 2018, for a family comprising of 3.6 consumption units.[25] Note that this recommendation is 16% higher for rural areas and 33% higher for urban areas as compared to the poverty line for 2018 mentioned above (Rs 8,400 per month) derived from the Planning Commission’s original benchmark for rural poverty.
If we take this to be a more appropriate poverty line, then the percentage of population below the poverty line would be even higher than the staggering poverty estimates given above — at least 84%, as per the Labour Bureau EUS data!
The Poverty Situation Today
During the period 2017–18 to 2019–20, the Indian economy experienced its most prolonged growth slowdown in decades (we have discussed this in Part 1).
After that, the corona pandemic hit the country. The Modi Government’s callous handling of the epidemic, the unplanned and brutal lockdown, and the paltry relief package, totally devastated the economy, and it suffered its most severe collapse in post-independent India. While the Modi Government’s propagandists have been manipulating data to show that the economy suffered only a very limited slowdown and quickly recovered after that, and that no decline in poverty took place even during the corona years, several other studies come to totally different conclusions — which are more in tune with ground realities.
A study by Azim Premji University, State of Working: India 2021, has analysed the impact of Covid on household incomes. The study found that from March to October 2020, households experienced a significant loss of income (as compared to the previous eight months, July 2019 to February 2020). The income loss was more pronounced among the poorer households, leading to a substantial rise in poverty across the country. The study takes the poverty line as the national floor-level minimum wage recommended by the Anoop Satpathy committee, after adjusting it for inflation up to 2020. Basing itself on this poverty line, the study reveals that during these eight months of 2020, an additional 23 crore people fell into poverty.[26]
Another study by Pew Research Centre, a non-partisan American think tank based in Washington, D.C., has also come to a similar conclusion. Basing itself on the World Bank poverty line of $2 a day, it estimates that:
- Absolute increase in poverty in India in 2020 due to the pandemic: 7.5 crore;
- Global increase in poverty in 2020 due to the pandemic: 12.5 crore (which implies that India’s 7.5 crore increase constituted 60% of the total global poverty increase).[27]
Whatever be the actual figure — 7.5 crore or 23 crore — both the above studies are in conformity with the observed ground reality that the Indian economy suffered an unprecedented economic collapse in 2020, which pushed crores of Indians into poverty.
As we have discussed in Part 1 of this article series, the post-pandemic recovery has not been as robust as that projected by official data. And this recovery is mainly in the organised sector, which provides just 6–8% of the total employment; the unorganised sector that provides employment to more than 90% of workforce continues to be in crisis. Therefore, the post-pandemic recovery must not have lifted many people out of poverty, as is being claimed by the government’s new poverty index, NMPI.
This is borne out by recent data related to earnings of workers. We have discussed this in detail in Part 2 of this article series. Nearly 50% of the workers are self-employed, and 25% are casual workers. Government PLFS data itself shows that two years after the pandemic, the real wages of the self-employed workers in 2021–22 were below 2017–18 levels. It is only in 2022–23 that they crossed the pre-pandemic levels. And though the wages of the casual workers did see some marginal rise over the period 2017–18 to 2022–23, even after this increase, the average wage of the casual workers in 2022–23 was only Rs 7,899 — much below the poverty line.[28] This means that nearly all the casual workers are living in penury!
These figures are corroborated by another recent data set. Of the 28 crore unorganised sector workers registered on the e-Shram portal as of 2022, 94% reported an income of less than Rs 10,000 per month.[29] This figure is less than the Planning Commission’s original poverty line updated to 2022–23 (Rs 10,981).[30]
Data from another recent survey also gives similar results. The Bihar caste survey (that made headlines for several months because of intense opposition by the Modi Government) has taken a poverty line of Rs 6,000 per month for a household of four, which is very close to the Tendulkar committee poverty line of 2011–12, updated to 2022–23. It shows that 34.1% of Bihar’s population has a monthly household income of Rs 6,000 or less. On the other hand, if we take the original Planning Commission poverty line (at which rural households can access 2200 calories in rural India), and update it to 2022–23, it works out to Rs 10,981 per month. If we take this as the benchmark, then according to the Bihar caste survey around 65% of the population in the State was living below this poverty line.[31]
Finally, these figures match another shocking data from a report by five organisations of the United Nations (FAO, IFAD, UNICEF, WFP and WHO), that estimates that 104.3 crore Indians (nearly 75% of the population) are unable to afford a healthy diet.[32]
All these various datasets only point to one inescapable conclusion — that at least 60 to 70% of the country’s population does not earn what can be called a living wage and lives in destitution.
Rising Suicide Rate
That the country is facing a huge unemployment and poverty crisis is also reflected in another grim statistic: rising suicides among daily wage earners, the self-employed and the unemployed. According to NCRB data, not only has the number of suicides in the country been going up in absolute numbers, it is also increasing as a percentage of the population. And within the total suicides, the number of daily wage earners, self-employed and unemployed who took their lives has also been increasing, and in 2022, this number was as high as 47% (see Table 2). And if we include farm labourers in this data, the number crosses 50%. Nearly 47,000 farm labourers have committed suicide during the first 8 Modi years (2014–22).[33]
Table 2: Suicides in India, 2017 to 2021
*Rate of suicides = Incidence of suicides per one lakh population
A quarter of the suicides in the country are of daily wage workers (26.4% in 2022, or 45,000 workers); 19,500 self employed workers also committed suicide in 2022. Obviously, the prime reason for their committing suicide is economic distress — a reflection of the fact that real wages / earnings in the country are so low that people are finding it difficult to make ends meet, and are committing suicide out of frustration.
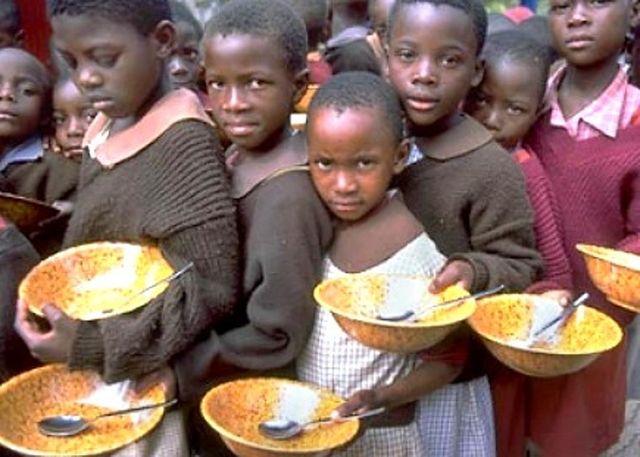
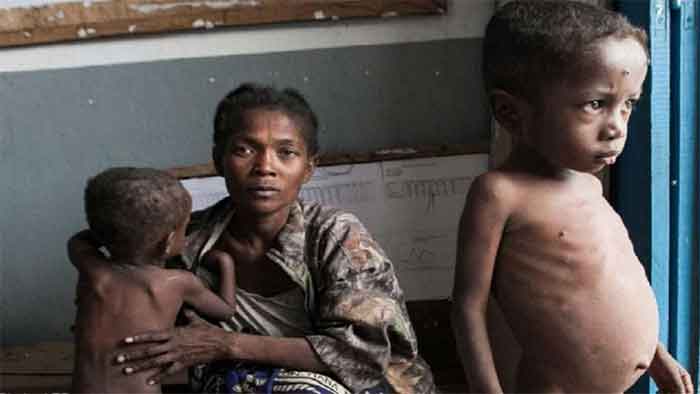
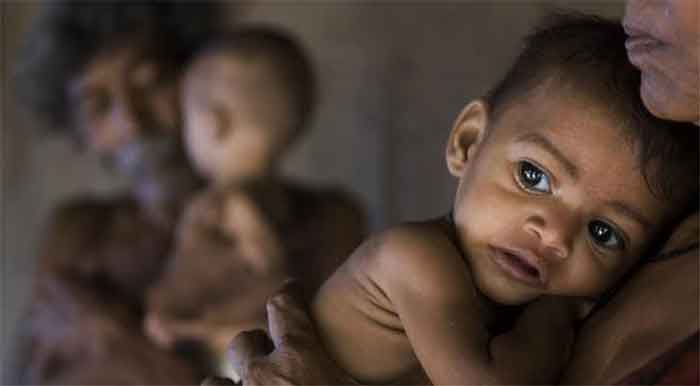
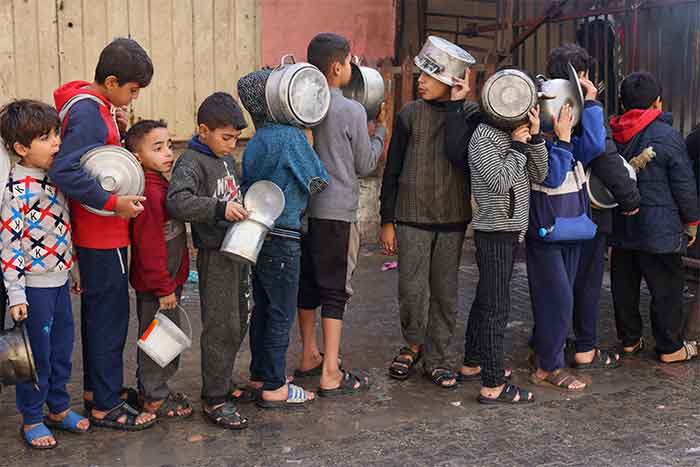
Hunger and Malnutrition Emergency
Such huge poverty levels also mean the country would be facing a ‘hunger emergency’ too.
As mentioned above, the Modi Government has suppressed release of all data on the condition of the people, including nutritional status of the Indian population. But there are several facts available from multiple sources that show that large sections of the Indian people are undernourished or face hunger:
Leaked excerpts from the NSSO’s HCES 2017–18 reveal that there has been a dip in food consumption for the first time in decades. Monthly spending of rural Indians on food fell from Rs 643 in 2011–12 to Rs 580 in 2017–18 (both figures in real terms). Note that the figure for 2011–12 itself was low; it has fallen further.[34]
The National Family Health Survey–5 (NFHS–5) of 2019–21, whose data was released in 2022, found that:
- 36% of children under the age of five are stunted (indicating chronic or long-term malnutrition); 19% are wasted (indicating acute malnutrition); and 32% are underweight (indicating both chronic and acute malnutrition).
- 57% of women suffer from anaemia, of whom 31.4% suffered from severe anaemia.[35]
(Following the release of NFHS–5, the Modi Government suspended the director of the institution that conducted the survey, the International Institute for Population Sciences![36])
Latest figures from the UN Food and Agricultural Organisation (FAO), for the year 2019, which are based on data provided by governments, also show that the nutritional intake of India’s population is very low. The FAO data in fact show that Indians consume significantly less food than every other region in the world, including the least developed countries! India’s consumption of cereals as food plus feed was just 171 kg per capita per year, compared to 190 kg for Africa, 205 kg for the least developed countries, 360 kg for both China and Brazil, and 407 kg for Russia. For the developed countries, this figure was 494 kg in the European Union and 590 kg in the United States. The world average was 304 kg.[37]
More recent data from a report, State of Food Security and Nutrition in the World (SOFI), published jointly by five UN organisations (including the FAO), presents an assessment of the prevalence of moderate or severe food insecurity (PMSFI) around the world, based on the food insecurity experience scale (FIES), a widely accepted index. The latest edition of the report for the year 2023 presents alarming data for India:
- The number of people suffering from moderate or severe food insecurity was 36.8 crore in 2014–16 (28.1% of the population). During the triennium 2019–21, this figure had increased to 56.4 crore people (40.8% of the population). And during the triennium 2020–22, this further increased to 59 crore (42.3% of the population). The number of people suffering moderate or severe insecurity has increased by more than 14 percentage points during the Modi years. That is a shocking increase! (SOFI defines food insecurity as: People are moderately food insecure when they are uncertain about their ability to obtain food, and so reduce the quantity of food they eat; people are severely food insecure when they experience hunger, and go for days without food.)
- The proportion of the population that is severely food insecure in the country has risen by nearly 50% over this period, from 20.5 crore (15.6% of the population) in 2014–16 to 30.8 crore (22.3% of the population) in 2019–21 to 32.2 crore (23.1% of population) in 2020–22.
- India alone accounted for more than one-third, or 36% of the severely food-insecure population in the world in the triennium 2020–22.[38]
These are staggering figures. No wonder that though the UN agencies involved in the publication of this report conducted data surveys in India, the self-obsessed Modi Government refused to allow publication of data related to India in this report! We have calculated PMSFI data for India by subtracting the data for “South Asia excluding India” from the total figure for South Asia.[39]
These findings by UN agencies are supported by another survey, conducted between December 2021 and January 2022. This survey, by the Right to Food Campaign, the Centre for Equity Studies, and some other organisations, calculated “food insecurity” based on the methodology developed by the FAO for the above mentioned survey. Its results say:
- A total of 79% of Indian households across 14 states which responded to the survey reported some form of “food insecurity” in 2021.
- As many as 25% of the families reported facing “severe food insecurity”, such as skipping meals, cutting back on food, running out of food, not eating throughout the day and going to bed hungry.[40]
Therefore, it is not at all surprising that in 2023, the Global Hunger Index (GHI) has ranked India at a low 111 out of the 125 countries for which the ranking was done (high income countries are not ranked). The GHI is a report brought out annually by two European organisations that attempts to track and measure hunger globally as well as by country. The GHI score is based on a formula which combines four indicators that together capture the multi-dimensional nature of hunger, including under-nourishment, child stunting, child wasting, and child mortality. India’s hunger levels have been rated as “serious” by the latest edition of the report. Only a few countries like Afghanistan, Haiti and a few sub-Saharan countries are ranked below India.[41]
Despite the presence of so much evidence regarding the country’s abysmal poverty levels, and the alarming hunger crisis facing the country, the Modi Government has denied all of it, claiming that it is a conspiracy to malign the country. Not only that, it has manufactured a report to claim that in the 9 years to 2023, nearly 25 crore people have been lifted out of poverty, and that in 2022–23, only 5% people were below the poverty line!
But then this shouldn’t be surprising, considering that PM Modi and his government have told innumerable lies ever since he came to power in 2014, from increasing farmers’ incomes to demonetisation to the corona relief package to electoral bonds to … The full list of his lies could fill a library.
Let us conclude this article with a quote from the eminent economist, Prabhat Patnaik. In an article published in the National Herald on Modi Government’s rejection of the Global Hunger Index, he writes:
Whatever the differences between fascist parties and movements may be, one element binds them all — the outright rejection of any evidence that contradicts the narrative they spin.
Hindutva at the helm in India is no exception. Its narrative presents India as the fastest growing economy in the world, where people have never had it so good. And if the facts collected by international agencies or even by the government’s own agencies reveal otherwise — why, then the facts must be wrong.
In keeping with the Führerprinzip or leadership principle, who dares contest what the leader has said? Reality is whatever Modi says it is. The rest is conspiracy.[42]
Notes
1. For those interested in reading Part 1 and 2 of this article series, they have been published by Countercurrents.org, and can be read online at: Neeraj Jain, “Is India Becoming a $5 Trillion Economy Soon?”, 28 April 2024, https://countercurrents.org; and Neeraj Jain, “The Economic Situation in 2023–24 Part 2: India’s Appalling Unemployment Crisis”, 29 April 2024, https://countercurrents.org.
2. “Poverty Levels Below 5%, Claims NITI Aayog Chief”, 25 February 2024, https://www.thehindu.com.
3. Santosh Mehrotra and Rakesh Ranjan Kumar, “Why the 2023 Consumption Survey Is Not Comparable with Previous Rounds”, 27 February 2024, https://thewire.in.; Prashanth Perumal J., “Has Poverty Really Dropped to 5% in India?”, 15 March 2024, https://www.thehindu.com.
4. “Poverty Levels Below 5%, Claims NITI Aayog Chief”, 25 February 2024, https://www.thehindu.com; Prabhat Patnaik, “Once More on Poverty Figures of India”, 25 March 2024, https://www.networkideas.org; Surjit Bhalla, a prominent mainstream economist and India’s former executive director at the IMF, also makes the same argument based on the same calculation in a discussion with Jayati Ghosh moderated by Prashanth Perumal J., “Has Poverty Really Dropped to 5% in India?”, ibid.
5. Santosh Mehrotra and Rakesh Ranjan Kumar, “Why the 2023 Consumption Survey Is Not Comparable with Previous Rounds”, op. cit.; Prabhat Patnaik, “Once More on Poverty Figures of India”, ibid.
6. Prabhat Patnaik, “Once More on Poverty Figures of India”, ibid.
7. “24.82 Crore Indians Escape Multidimensional Poverty in Last 9 Years”, Niti Aayog, Press Release, 15 January 2024, https://pib.gov.in.
8. For more on this, see: Utsa Patnaik, “Number Games: India’s Declining Poverty Figures Based on Flawed Estimation method; Accurate Figures Show 75 Percent in Poverty”, Academics Stand Against Poverty, https://academicsstand.org; Utsa Patnaik, Republic of Hunger and Other Essays, Three Essays Collective, March 2007.
9. For more on this, see: Santosh Mehrotra, “Everything Wrong with NITI Aayog’s Claim of 24.8 Crore Emerging Out of Poverty in 9 Years”, 16 January 2024, https://thewire.in.
10. “’Hunger, Undernutrition Stalking India; Placed Worse Than Least Developed Nations’: Prabhat Patnaik”, Subhoranjan Dasgupta interviews Prabhat Patnaik, 19 January 2024, https://thewire.in; Prabhat Patnaik, “The Poverty of UN Poverty Estimates”, 31 July 2023, https://www.networkideas.org; “National Multidimensional Poverty Index”, Niti Aayog, 17 July 2023, https://www.niti.gov.in.
11. Santosh Mehrotra, “Everything Wrong with NITI Aayog’s Claim of 24.8 Crore Emerging Out of Poverty in 9 Years”, op. cit.; Deepanshu Mohan and Centre for New Economics Studies, “NiTi Aayog ‘Poverty’ Stats: Serious Theoretical, Methodological, Empirical Questions”, 18 January 2024, https://thewire.in.
12. Neeraj Jain, “Budget 2023–24: What Is in it for the People? Part 6: Cut in Social Sector Expenditures, Transfers to States”, 28 May 2023, https://janataweekly.org.
13. “National Multidimensional Poverty Index”, Niti Aayog, p. xv, op. cit.
14. Santosh Mehrotra, “Everything Wrong With NITI Aayog’s Claim of 24.8 Crore Emerging Out of Poverty in 9 Years”, op. cit.
15. Household Consumer Expenditure Survey, Press Release, 15 November 2019, https://pib.gov.in.
16. Pramit Bhattacharya, “India’s Statistical System: Past, Present, Future”, 28 June 2023, https://carnegieendowment.org.
17. “NSO Panel Did Not Recommend ‘Junking’ Consumer Survey Report”, The Quint, 21 November 2019, https://www.thequint.com; “Consumer Spend Survey: Panel Didn’t Flag Quality Issues, Ask for Scrapping”, 21 November 2019, https://www.business-standard.com; “Consumer Expenditure: Expert Panel Didn’t Suggest Withholding Findings, Reports Business Standard”, 21 November 2019, https://scroll.in.
18. “After Junking Report on Consumption, NSO Now Looks for Reasons”, 22 November 2019, https://www.livemint.com.
19. “Consumer Spending Sees First Fall in Over 40 Years on Back of Weak Rural Demand: Report”, 15 November 2019, https://thewire.in; “First In 46 Years, Food Consumption Falls, Modi Govt Scraps Consumer Spending Survey”, 18 November 2019, https://www.newsclick.in.
20. Note that here, we are using the original poverty line as defined by the Planning Commission. The Commission used this definition only once, to the 1973–4 data. Subsequently, for reasons unknown, it changed the definition in practice, and stopped looking directly at the total monthly spending on all goods and services which permitted nutrition norms to be accessed. This was despite the fact that every five years NSSO survey data made available the required information on this for every spending level. The definition the Planning Commission now adopted was that the 1973–74 poverty lines were to be adjusted for inflation using a price-index, regardless of whether the lines so obtained still allowed nutritional standards to be met. Ever since then, the new poverty line has had nothing to do with whether a person is able to access the minimum recommended calories. Since the new poverty lines were very low, following a huge outcry, in 2005, the government set up an expert group under the chairmanship of Professor Suresh Tendulkar to examine the issue and suggest a new poverty line and estimates. The Tendulkar committee, faithful to official sensibilities, merely tinkered with the poverty line. It produced the absurdity of Rs 22.4 and Rs 28.7 as the rural/urban daily poverty lines in 2009–10 (after adjusting for inflation), or Rs 673 and Rs 860 per month. But this allowed access to only 1870 calories in rural areas and 1720 calories in urban areas. Whereas, in 2009–10, nutrition data from the NSS 66th Round showed that a person needed to spend Rs 1100 in rural and Rs 2,120 in urban India a month to access 2,200 and 2,100 calories respectively. For more on this, see: Utsa Patnaik, “Number Games: India’s Declining Poverty Figures Based on Flawed Estimation method; Accurate Figures Show 75 Percent in Poverty”, op. cit.; Utsa Patnaik, “Poverty Trends in India 2004–05 to 2009–10”, Economic and Political Weekly, 5 October 2013, https://www.im4change.org.
21. Prabhat Patnaik, “Once More on Poverty Figures of India”, op. cit.
22. Vivek Kaul, “Book Excerpt: The Real Story Behind India’s Low Unemployment”, 19 April 2017, https://www.firstpost.com.
23. Jean Dreze, “Wages of Distress”, Indian Express, 13 April 2023.
24. This is as per the original poverty line defined by the Planning Commission in 1973–74, which defined it to be the per capita expenditure level at which 2200 calories were accessed in rural India. Prabhat Patnaik, “The Pervasiveness of Poverty in India”, 27 November 2023, https://www.networkideas.org.
25. “Expert Committee Submits its Report on Determining Methodology for Fixing National Minimum Wage”, 14 February 2019, https://pib.gov.in.
26. State of Working India 2021, p. 24, https://cse.azimpremjiuniversity.edu.in.
27. Rakesh Kochhar, “In the Pandemic, India’s Middle Class Shrinks and Poverty Spreads While China Sees Smaller Changes”, 18 March 2021, https://www.pewresearch.org.
28. Here, by poverty line, we mean the original poverty line defined by the Planning Commission in 1973–74 – whose value adjusted for 2022–23 is Rs 10,981 per month (see endnote 31). And if take the poverty line as defined by Anoop Satpathy committee, adjusting it to 2022–23 using the Agricultural Labourers Price Index, it works out to Rs 12,956. The average wage of the self-employed workers was Rs 13,347 in 2022–23. This means more than 80% of the self-employed workers would also be living below the poverty line.
29. “Income of 94.11% Registered Informal Workers at Rs 10,000 or Below”, 29 May 2022, https://www.business-standard.com.
30. See below, and also endnote 31.
31. Prabhat Patnaik, “The Pervasiveness of Poverty in India”, op. cit.
32. The State of Food Security and Nutrition in the World 2023, p. 209, https://www.fao.org.
33. Accidental Deaths and Suicides in India 2022, NCRB, https://ncrb.gov.in and similar NCRB reports for previous years.
34. “First In 46 Years, Food Consumption Falls, Modi Govt Scraps Consumer Spending Survey”, 18 November 2019, https://www.newsclick.in.
35. Payal Seth and Palakh Jain, “What NFHS–5 Tells Us About the Status of Child Nutrition in India”, 26 November 2021, https://thewire.in; Utsa Patnaik, “Shooting the Messenger: Adverse Health Trends Revealed in the NFHS (5) 2019–2021”, Peoples Democracy, 13 August 2023, https://peoplesdemocracy.in.
36. “’Unhappy With Data Sets,’ Modi Govt Suspends Director of Institute Which Prepares NFHS”, 28 July 2023, https://thewire.in.
37. Utsa Patnaik, “Shooting the Messenger: Adverse Health Trends Revealed in the NFHS (5) 2019–2021”, Peoples Democracy, 13 August 2023, https://peoplesdemocracy.in.
38. The State of Food Security and Nutrition in the World 2022 and 2023, https://www.fao.org. Population data from: Human Population Estimates & Projections, FAO, https://data.apps.fao.org.
39. T.K. Rajalakshmi, “Starved of Data: India’s Hungry People Go Missing from FAO Report”, Frontline, 24 July 2022, https://frontline.thehindu.com.
40. “79% of Indian Households Experienced ‘Food Insecurity’ Last Year, Shows Survey”, Scroll Staff, 23 February 2022, https://scroll.in. Deepanshu Mohan and Centre for New Economics Studies, “NiTi Aayog ‘Poverty’ Stats: Serious Theoretical, Methodological, Empirical Questions”, op. cit.
41. Jagriti Chandra, “India Ranks 111 Out of 125 Countries in Global Hunger Index”, 12 October 2023, https://www.thehindu.com.
42. Prabhat Patnaik, “Global Hunger Index: Evidence Speaks Louder Than Denial”, 8 November 2023, https://www.nationalheraldindia.com.
…………………………………………………………………………………………………………………………………………….
About the author:
Neeraj Jain is a BTech in Electrical Engineering. He is a social-political activist with an activist group called Lokayat in Pune, and is also the Associate Editor of Janata Weekly, a weekly print magazine and blog published from Mumbai.
Email: [email protected].